Dams Sector Consequence-Based Top Screen Methodology
Dams Sector Consequence-Based Top Screen Methodology
Dams Sector Consequence-Based Top Screen Methodology

Create successful ePaper yourself
Turn your PDF publications into a flip-book with our unique Google optimized e-Paper software.
• If available, provide the estimated value of M 2 .<br />
• Describe the agricultural markets or regions served by the facility.<br />
• Indicate how the values selected above for annual water deliveries were obtained. Please<br />
identify relevant data sources and reference materials (if applicable, include title, author,<br />
date, and/or version of any report, study and/or data source used as reference).<br />
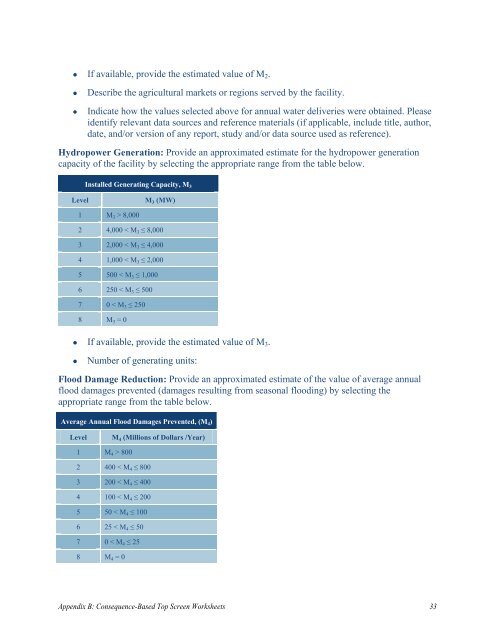
Hydropower Generation: Provide an approximated estimate for the hydropower generation<br />
capacity of the facility by selecting the appropriate range from the table below.<br />
Installed Generating Capacity, M 3<br />
Level<br />
M 3 (MW)<br />
1 M 3 > 8,000<br />
2 4,000 < M 3 ≤ 8,000<br />
3 2,000 < M 3 ≤ 4,000<br />
4 1,000 < M 3 ≤ 2,000<br />
5 500 < M 3 ≤ 1,000<br />
6 250 < M 3 ≤ 500<br />
7 0 < M 3 ≤ 250<br />
8 M 3 = 0<br />
• If available, provide the estimated value of M 3 .<br />
• Number of generating units:<br />
Flood Damage Reduction: Provide an approximated estimate of the value of average annual<br />
flood damages prevented (damages resulting from seasonal flooding) by selecting the<br />
appropriate range from the table below.<br />
Average Annual Flood Damages Prevented, (M 4 )<br />
Level<br />
M 4 (Millions of Dollars /Year)<br />
1 M 4 > 800<br />
2 400 < M 4 ≤ 800<br />
3 200 < M 4 ≤ 400<br />
4 100 < M 4 ≤ 200<br />
5 50 < M 4 ≤ 100<br />
6 25 < M 4 ≤ 50<br />
7 0 < M 4 ≤ 25<br />
8 M 4 = 0<br />
Appendix B: <strong>Consequence</strong>-<strong>Based</strong> <strong>Top</strong> <strong>Screen</strong> Worksheets 33