Dams Sector Consequence-Based Top Screen Methodology
Dams Sector Consequence-Based Top Screen Methodology
Dams Sector Consequence-Based Top Screen Methodology
Create successful ePaper yourself
Turn your PDF publications into a flip-book with our unique Google optimized e-Paper software.
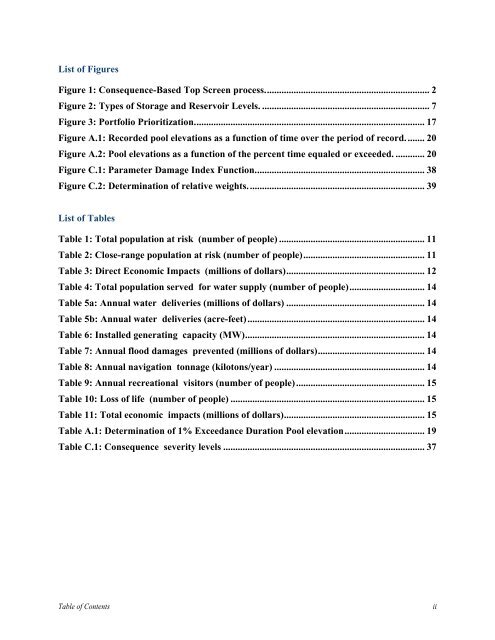
List of Figures<br />
Figure 1: <strong>Consequence</strong>-<strong>Based</strong> <strong>Top</strong> <strong>Screen</strong> process.................................................................... 2<br />
Figure 2: Types of Storage and Reservoir Levels. ..................................................................... 7<br />
Figure 3: Portfolio Prioritization............................................................................................... 17<br />
Figure A.1: Recorded pool elevations as a function of time over the period of record........ 20<br />
Figure A.2: Pool elevations as a function of the percent time equaled or exceeded. ............ 20<br />
Figure C.1: Parameter Damage Index Function...................................................................... 38<br />
Figure C.2: Determination of relative weights......................................................................... 39<br />
List of Tables<br />
Table 1: Total population at risk (number of people) ............................................................ 11<br />
Table 2: Close-range population at risk (number of people).................................................. 11<br />
Table 3: Direct Economic Impacts (millions of dollars)......................................................... 12<br />
Table 4: Total population served for water supply (number of people)............................... 14<br />
Table 5a: Annual water deliveries (millions of dollars) ......................................................... 14<br />
Table 5b: Annual water deliveries (acre-feet)......................................................................... 14<br />
Table 6: Installed generating capacity (MW).......................................................................... 14<br />
Table 7: Annual flood damages prevented (millions of dollars)............................................ 14<br />
Table 8: Annual navigation tonnage (kilotons/year) .............................................................. 14<br />
Table 9: Annual recreational visitors (number of people)..................................................... 15<br />
Table 10: Loss of life (number of people) ................................................................................ 15<br />
Table 11: Total economic impacts (millions of dollars).......................................................... 15<br />
Table A.1: Determination of 1% Exceedance Duration Pool elevation................................. 19<br />
Table C.1: <strong>Consequence</strong> severity levels ................................................................................... 37<br />
Table of Contents<br />
ii


