Manual - Spectratime
Manual - Spectratime
Manual - Spectratime

Create successful ePaper yourself
Turn your PDF publications into a flip-book with our unique Google optimized e-Paper software.
iTest+® PicoTime <strong>Manual</strong><br />
18 August 2005<br />
PRELIMINARY<br />
Low Cost / Profile High resolution Frequency Stability Measurement Test Set<br />
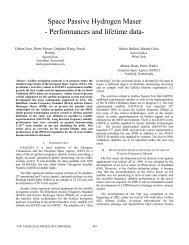
Pico Second Resolution Test Set<br />
Easy-to-Use RF Device & User-Friendly Windows Software<br />
Calibration | Oscillator/Clock Characterization | TIE Measurements | Instrument<br />
Applications<br />
©SpectraTime Europe Headquarters North America Sales Offices<br />
sales@spectratime.com +41.32.732.16.66 +1.512.470.3980<br />
spectratime.com
iTest+® PicoTime <strong>Manual</strong><br />
Table of Content :<br />
1. INTRODUCTION ..............................................................................................................................................................3<br />
2. PicoTime / RS SYSTEM DESCRIPTION.........................................................................................................................3<br />
3. PicoTime / RS INSTALLATION.......................................................................................................................................5<br />
3.1 Safety ! ........................................................................................................................................................5<br />
3.2 Unpacking...................................................................................................................................................5<br />
3.3 Software installation..................................................................................................................................5<br />
3.4 Connections ...............................................................................................................................................5<br />
4. PicoTime / RS OPERATION............................................................................................................................................7<br />
4.1 Definition of the menus and parameters .................................................................................................9<br />
4.1.1 File ........................................................................................................................................................9<br />
4.1.2 Port .....................................................................................................................................................11<br />
4.1.3 Mode ...................................................................................................................................................11<br />
4.1.4 Store ...................................................................................................................................................11<br />
4.1.5 Display ................................................................................................................................................11<br />
4.1.6 Graphic ...............................................................................................................................................11<br />
4.1.7 Select ..................................................................................................................................................13<br />
4.1.8 About...................................................................................................................................................14<br />
4.2 During Measurement ...............................................................................................................................15<br />
4.2.1 Data plot..............................................................................................................................................15<br />
4.2.2 Stability plot.........................................................................................................................................16<br />
4.2.3 Maximum number of samples.............................................................................................................16<br />
4.2.4 Graphics update..................................................................................................................................17<br />
4.2.5 Graphics user interaction....................................................................................................................18<br />
5. THEORY.........................................................................................................................................................................19<br />
5.1 The Allan Deviation..................................................................................................................................19<br />
5.2 Confidence Interval..................................................................................................................................19<br />
6. SYSTEM TESTS ............................................................................................................................................................20<br />
7. TYPICAL MEASUREMENT ...........................................................................................................................................22<br />
8. TROUBLE SHOOTING ..................................................................................................................................................24<br />
9. GLOSSARY....................................................................................................................................................................25<br />
©SpectraTime Europe Headquarters North America Sales Offices Page 2 of 25<br />
sales@spectratime.com +41.32.732.16.66 +1.512.470.3980<br />
spectratime.com
iTest+® PicoTime <strong>Manual</strong><br />
1. INTRODUCTION<br />
Picotime procures an attractive solution for the characterization of quartz crystal oscillators, atomic clocks or<br />
entire systems. It can also be used for the calibration of high stable oscillators and atomic clocks.<br />
Picotime is designed for ease of use, configures itself the system and collects data to allow post-processing.<br />
According to the standard serial COM interface, wide range input frequency, small volume and the automatic<br />
operation, the system is very flexible and easy to use.<br />
The user software is able to show the time stability results as well as the frequency or phase samples in real<br />
time. In addition, the data are stored into a file which is completely compatible with conventional postprocessing<br />
software.<br />
2. PicoTime / RS SYSTEM DESCRIPTION<br />
Picotime measures the time difference between a reference of 10 MHz and a DUT with a frequency range<br />
between 1 to 30 MHZ to plot the Allan deviation.<br />
A frequency measurement is used for programming the DDS which divides the device frequency around 1 KHz<br />
by using two mixers. As the block-diagram shows, the whole system is based on a heterodyne architecture with<br />
a double frequency conversion. After that, the system measures several phase intervals to obtain more precise<br />
frequency measurement. With this new frequency value, the DDS are re-programmed to have a frequency beat<br />
the closest to 1KHz. The Allan deviation is plotted by measuring the phase difference between the PPS<br />
reference and the frequency beat of 1KHz. This way, the phase intervals are sampled to obtain the stability of<br />
the device under test.<br />
The 26 bits time interval counter is controlled through the COM interface such as for the programming of the<br />
two DDS.<br />
The reference and the DUT are connected to the system with two BNC, and three outputs are available for the<br />
user through three BNC connectors:<br />
• 1 PPS ref.<br />
• IF of 1 KHz with a BW of several 100KHz.<br />
• IF of 1 KHz with a BW of only 1Hz / FDUT when the DDS are not programmed.<br />
©SpectraTime Europe Headquarters North America Sales Offices Page 3 of 25<br />
sales@spectratime.com +41.32.732.16.66 +1.512.470.3980<br />
spectratime.com
iTest+® PicoTime <strong>Manual</strong><br />
F DUT<br />
10MHz ref<br />
Mult.12<br />
DDS1<br />
DDS2<br />
Div. 32<br />
Div.1E7<br />
BP<br />
LP<br />
XTAL<br />
1KHz<br />
filtered<br />
1KHz<br />
1PPS ref<br />
Time interval counter<br />
External counter<br />
Fig. 1 : Picotime / RS block diagram<br />
©SpectraTime Europe Headquarters North America Sales Offices Page 4 of 25<br />
sales@spectratime.com +41.32.732.16.66 +1.512.470.3980<br />
spectratime.com
iTest+® PicoTime <strong>Manual</strong><br />
3. PicoTime / RS INSTALLATION<br />
3.1 Safety !<br />
- Use proper ESD precautions<br />
- Ensure that all cables are properly connected<br />
- Ensure Picotime connected to earth through<br />
the RS interface before power supply<br />
connection.<br />
3.2 Unpacking<br />
Unpack and carefully inspect the unit. Check for physical damage. If physical damage is observed, then<br />
immediately contact <strong>Spectratime</strong> SA.<br />
Unit supply:<br />
• 1 PicoTime unit<br />
• 1 Power supply 230V/50Hz-12VDC<br />
• 1 Cable SUB-D 9 pins male/female<br />
• 1 CD-ROM PicoTime installation software<br />
• 1 User manual + Specifications on CD-Rom<br />
• 1 US power cable<br />
• 1 Euro power cable<br />
• In option Stable32 software on CD-Rom<br />
Cables required:<br />
Two coaxial cables terminated at one end with male BNC connectors. The other end should have the<br />
appropriate connector as determined by your application. Try to use the shorter cables as possible to obtain the<br />
most appropriate conditions for measurements.<br />
3.3 Software installation<br />
• Close all applications and run the Setup.exe from the CD-ROM and follow the instructions. The<br />
program PicoTime will be installed in the start menu by default.<br />
3.4 Connections<br />
• Connect the 10MHz reference and the DUT to the FSMS unit.<br />
• Connect the male SUB-D-9 to the unit and female SUB-D-9 to the computer. The system can be<br />
connected to COM1 to COM4. Connect the power supply to the unit.<br />
• Connect the DUT, the Picotime and the computer to the same ground without using galvanic insulation.<br />
©SpectraTime Europe Headquarters North America Sales Offices Page 5 of 25<br />
sales@spectratime.com +41.32.732.16.66 +1.512.470.3980<br />
spectratime.com
iTest+® PicoTime <strong>Manual</strong><br />
Fig. 2 : Connections<br />
<strong>Spectratime</strong> recommends the users to warm up PicoTime several hours before starting any measurements.<br />
For very short term stability measurements, the warm-up time does not need to be very long because the<br />
temperature fluctuations will not be apparent on very short time analysis.<br />
When the power supply is applied to the Picotime unit, the red led switches on.<br />
Three more interfaces are available on the front panel which correspond to the following signals:<br />
1 PPS reference<br />
1 KHz filtered after initialization / FDUT before initialization<br />
1 KHz non-filtered after initialization<br />
It offers the possibility of using the system with an external counter to allow different kind of measurements.<br />
<strong>Spectratime</strong> recommends to not use these interfaces if the internal counter of the Picotime unit is preferred.<br />
To start a measurement, click on PicoTimeRS from the start menu. The PicoTime application appears on the<br />
screen. See section operation to set and use the system correctly.<br />
©SpectraTime Europe Headquarters North America Sales Offices Page 6 of 25<br />
sales@spectratime.com +41.32.732.16.66 +1.512.470.3980<br />
spectratime.com
iTest+® PicoTime <strong>Manual</strong><br />
4. PicoTime / RS OPERATION<br />
PicoTime is designed for ease of use, it configures itself the system and collects data.<br />
The unit measures the frequency of the DUT to program a first time the internal DDS. Then, the system<br />
measures several phase differences between the 1PPS reference and the 1KHz non-filtered to obtain a fine<br />
measurement of the DUT frequency. Finally, the DDS are re-programmed with the precise frequency and the<br />
system waits for the locking of the quartz crystal filter in the case of the selection of the filtered mode. The Allan<br />
deviation plot, the Phase difference plot or the Frequency difference plot are displayed in real time and the data<br />
are stored into a file every new sample.<br />
To obtain a complete analysis, post processing, <strong>Spectratime</strong> SA suggests to use Stable32 from Hamilton<br />
technical services. PicoTime writes a file with the extension “ *.DAT ” which contains the frequency data or<br />
phase data and is completely compatible with Stable 32.<br />
The nature and the stability of the DUT define which 10MHz reference is able to be used, taking into account<br />
that the reference has to offer a better characteristic for the range of measurement. The frequency range of the<br />
DUT is any values between 1MHz to 30MHz inclusively.<br />
The resolution of the system increases with the frequency of the device under test, at 1s the following<br />
resolutions are obtained in filtered mode.<br />
F DUT<br />
Resolution in filtered mode<br />
1MHz 2E-11<br />
10MHz 2E-12<br />
30MHz < 2E-12<br />
And in non-filtered mode following resolutions are obtained.<br />
F DUT<br />
Resolution in non-filtered mode<br />
1MHz 1E-10<br />
10MHz 1E-11<br />
30MHz < 1E-11<br />
©SpectraTime Europe Headquarters North America Sales Offices Page 7 of 25<br />
sales@spectratime.com +41.32.732.16.66 +1.512.470.3980<br />
spectratime.com
iTest+® PicoTime <strong>Manual</strong><br />
The following figure shows the hierarchy of the software.<br />
Start<br />
Picotime<br />
[COM<br />
Setting]<br />
Save File<br />
Initialization<br />
[Options]<br />
Start<br />
Measure<br />
Fig. 3 : Software hierarchy<br />
The easy to use software has been designed to achieve a very easy and fast measurement. COM number and<br />
several option settings are kept into memory to avoid repetitive setting and checking.<br />
©SpectraTime Europe Headquarters North America Sales Offices Page 8 of 25<br />
sales@spectratime.com +41.32.732.16.66 +1.512.470.3980<br />
spectratime.com
iTest+® PicoTime <strong>Manual</strong><br />
4.1 Definition of the menus and parameters<br />
Figure 4 shows the display when the user runs PicotimeRS from the start menu of Windows.<br />
Fig. 4 : Starting display<br />
The screen is composed of a main window which contains several menus and a status bar. Two graphic<br />
windows are loaded, one for the frequency or phase data and one for the computation of the Allan deviation.<br />
4.1.1 File<br />
The menu File is the main menu of PicoTime. Before any action, the COM interface has to be set once, refer to<br />
section 4.1.2.<br />
The sub-menu Save File as is used to save the data into a selected file. A message box “Save file as” appears<br />
and allows the user to save a file with the extension *.DAT in which all the data are saved to be post processed<br />
for a complete stability analysis with a software such as Stable32.<br />
Only after the Save action, the sub menu Initialization becomes enabled.<br />
The file path, date, time, DUT frequency, tau, Mode and Data type are inserted in the header of the file to have<br />
all the parameters for the post processing analysis. The measurement data are saved after every new sample.<br />
C:\Mes Documents\Demo.DAT Date 3/20/03 Time 12:38:15 PM<br />
DUT Frequency : 10000000<br />
Tau : 1000.0 ms<br />
Mode : Filtered<br />
Data : Frequency Data<br />
©SpectraTime Europe Headquarters North America Sales Offices Page 9 of 25<br />
sales@spectratime.com +41.32.732.16.66 +1.512.470.3980<br />
spectratime.com
iTest+® PicoTime <strong>Manual</strong><br />
Fig. 5 : Save file as<br />
The sub-menu Initialization becomes enabled only if the user has saved the measurement file. This function<br />
initializes PicoTime.<br />
First, the frequency of the DUT is measured to program the internal DDS to achieve a frequency beat around<br />
1KHz. If the DUT frequency is not in the range of 1MHz to 30MHz the status message “Frequency out of range”<br />
appears. After that, several phase points are measured to obtain a fine frequency measurement and finally the<br />
DDS are re-programmed with the fine DUT frequency which is displayed in a small window<br />
The user has to wait until the locking of the quartz filter if the Filtered mode is selected. It needs several<br />
seconds. When the crystal filter is locked, the red led is switched off and the green one becomes lit. The status<br />
bar indicates : “XTAL filter locked”.<br />
If the Non-Filtered mode is selected, after Initialization, the status bar indicates : “Ready to start”.<br />
Fig. 6 : DUT Frequency<br />
A message box automatically appears to inform the user that the nominal frequency could be normalized.<br />
Yes : Refer to section 4.1.7, Normalize DUT Frequency.<br />
No : The nominal frequency is set to the DUT frequency measured by PicoTime (Textbox figure 6).<br />
Sub menu Start Measure starts the measurement with all the parameters entered in the other menus (refer to<br />
followings sections). The status bar indicates “Running…”<br />
Stop Measure sub-menu stops the measurement without resetting the internal DDS. This way, the options<br />
could be changed and the measurement could restart immediately. The status bar indicates “Stop”.<br />
Quit closes the application.<br />
©SpectraTime Europe Headquarters North America Sales Offices Page 10 of 25<br />
sales@spectratime.com +41.32.732.16.66 +1.512.470.3980<br />
spectratime.com
iTest+® PicoTime <strong>Manual</strong><br />
4.1.2 Port<br />
Previously to start the application, the user has to connect the serial connector to one available COM interface<br />
on the computer (COM1 or COM2 or COM3 or COM4). This COM interface is set by selecting the appropriate<br />
COM number in the Port menu. The operation is only required once because the COM selection is kept into<br />
memory and the same parameters will be loaded when the user restart the application.<br />
4.1.3 Mode<br />
Two modes are available, Filtered or Non-Filtered. In Filtered mode, the maximum relative frequency deviation<br />
of the DUT has to be
iTest+® PicoTime <strong>Manual</strong><br />
Title sub-menu allows every time the user to edit the Titles of the graphics. This command is useful when<br />
printing the graphics.<br />
Fig. 8 : Title edition<br />
Print allows to print the Data plot or the Stability plot. A printer dialog box is loaded to select the appropriate<br />
printer, the number of copies and the orientation. For best results, a landscape orientation is recommended.<br />
Fig. 9 : Printer dialog box<br />
To save the graphics as a Bitmap format (*.BMP), use the sub-menu Save Picture and select the Data plot or<br />
Stability plot.<br />
©SpectraTime Europe Headquarters North America Sales Offices Page 12 of 25<br />
sales@spectratime.com +41.32.732.16.66 +1.512.470.3980<br />
spectratime.com
iTest+® PicoTime <strong>Manual</strong><br />
4.1.7 Select<br />
Sampling rate :<br />
The sampling rate could be set with the sub-menu Tau. A list box is loaded allowing to select a Tau value.<br />
Fig. 10 : Tau select<br />
The sampling rate needs to be selected according to the kind of stability analysis. In fact, PicoTime has a<br />
limitation of the number of samples (999999). For this reason, if the user wants a very long term stability<br />
analysis, a relative high sampling rate has to be chosen. On the other hand, a very short term stability analysis<br />
is only possible with a short sampling rate. Remember that the sampling rate corresponds to the minimum Tau<br />
of the Allan deviation. Another point is that the time process to plot the data and the Allan deviation is<br />
proportional to the number of samples and it is never useful to work with files of several MBytes.<br />
The default sampling rate is 1 second.<br />
The possible sampling rates are the following:<br />
Normalize DUT Frequency :<br />
Sampling rate<br />
(in second)<br />
1<br />
2<br />
3<br />
5<br />
10<br />
20<br />
30<br />
50<br />
100<br />
200<br />
300<br />
The frequency beat obtained by the programming of the DDS is never exactly 1KHz (resolution of the DDS) For<br />
this reason, the phase data will be a slope (negative or positive) following the value of the frequency beat (1KHz<br />
±ε ).<br />
The user has the possibility to enter a nominal DUT Frequency by clicking on the Normalize DUT Frequency<br />
menu. A window appears which is editable with a desired nominal frequency of the DUT. This way, the phase<br />
and frequency data during time will be normalized to the nominal frequency selected.<br />
Fig. 11 : Nominal DUT Frequency<br />
According to the reference used, the reel frequency of the DUT is the addition of the nominal frequency set and<br />
the real time frequency difference measured.<br />
F + F<br />
exact<br />
= Fno<br />
min al<br />
realTime<br />
©SpectraTime Europe Headquarters North America Sales Offices Page 13 of 25<br />
sales@spectratime.com +41.32.732.16.66 +1.512.470.3980<br />
spectratime.com
iTest+® PicoTime <strong>Manual</strong><br />
4.1.8 About<br />
To check the version of the PicoTime software, click on the menu About, the version is notified in the header of<br />
the window. The following window appears. The latest version can be downloaded – free of charge from<br />
<strong>Spectratime</strong> web-site: http://www.spectratime.com.<br />
Fig. 12 : PicoTime software Version<br />
All the setting windows could be closed by clicking on the cross in the up right corner of the corresponding<br />
window. This action does not change the setting. To disable the setting or the options, the respective menu has<br />
to be re-clicked (withdrawal of the tick).<br />
The following figure shows all the parameters or options that could be implemented.<br />
Fig. 13 : Graphics and parameters windows<br />
©SpectraTime Europe Headquarters North America Sales Offices Page 14 of 25<br />
sales@spectratime.com +41.32.732.16.66 +1.512.470.3980<br />
spectratime.com
iTest+® PicoTime <strong>Manual</strong><br />
4.2 During Measurement<br />
After the Start measure command, the menus are disabled, the parameters are set and can not be changed<br />
without stopping the measurement. The status bar displays : “Running…”.<br />
4.2.1 Data plot<br />
Following the setting of the display menu, the frequency or the phase difference is plotted in real time in the first<br />
graphic window. The graphic is updated every new sample.<br />
Fig. 14 : Frequency difference plot<br />
Fig. 15 : Phase difference plot<br />
©SpectraTime Europe Headquarters North America Sales Offices Page 15 of 25<br />
sales@spectratime.com +41.32.732.16.66 +1.512.470.3980<br />
spectratime.com
iTest+® PicoTime <strong>Manual</strong><br />
4.2.2 Stability plot<br />
The Standard Allan Deviation is plotted in the second graphic window. See section 4.2.4 for the update of the<br />
graphic.<br />
The Allan Deviation is displayed using Octave Tau increments.<br />
Fig. 16 : Standard Allan Deviation plot<br />
4.2.3 Maximum number of samples<br />
The maximum number of samples is restricted to 999999. For this reason, the sampling rate has to be selected<br />
accordingly to the kind of desired analysis.<br />
After 999999 samples, the measurement are automatically stopped and the following message box appears to<br />
advise the user.<br />
Fig. 17 : Sample 999999<br />
©SpectraTime Europe Headquarters North America Sales Offices Page 16 of 25<br />
sales@spectratime.com +41.32.732.16.66 +1.512.470.3980<br />
spectratime.com
iTest+® PicoTime <strong>Manual</strong><br />
4.2.4 Graphics update<br />
The Data plot is updated every new sample. The Allan Deviation Plot is updated every 10 new samples for a<br />
sampling rate lower than 10 seconds and every 3 new samples for a sampling rate equal or higher than 10<br />
seconds.<br />
Warning<br />
When 8192 samples have been available for calculating an Allan deviation point, this point will never be reupdated.<br />
The reason is to not use all the computer resources when calculating the Allan Deviation with a large<br />
number of samples.<br />
Example:<br />
Tau = 1 second<br />
The first Allan dev. point will be at 1 second.<br />
• The point at 1 second will be updated until 8192 samples, after the 8192 nd sample, this point will not be<br />
updated.<br />
• The point at 2 seconds will be updated until 16384 samples, after the 16384 th sample, this point will not be<br />
updated.<br />
• The point at 4 seconds will be updated until 32768 samples, after the 32768 th sample, this point will not be<br />
updated.<br />
• So on<br />
The complete analysis could be done by using a post processing software like Stable 32 which is available in<br />
option.<br />
Warning<br />
During measurement, do not disturb PicoTime and cables must not be touched !<br />
©SpectraTime Europe Headquarters North America Sales Offices Page 17 of 25<br />
sales@spectratime.com +41.32.732.16.66 +1.512.470.3980<br />
spectratime.com
iTest+® PicoTime <strong>Manual</strong><br />
4.2.5 Graphics user interaction<br />
Graphic windows offer several user interface commands, which help the user to navigate through a plot. The<br />
table below lists the default mapping of keyboard and mouse commands for several actions.<br />
Please note, that the control needs to have the input focus (highlighted chart border) by clicking on the<br />
respective graphic window before it can accept any keystrokes.<br />
c<br />
Ctrl+arrow key<br />
Ctrl+shift+arrow key<br />
Ctrl+left mouse button<br />
Tab<br />
Left/right arrow key<br />
Shift+left/right arrow key<br />
f<br />
Ctrl+left mouse button up<br />
Left mouse button up<br />
Cursor on / off<br />
Second cursor / toggle cursors<br />
Move cursor<br />
Fast move cursor<br />
Cursors floating / locked on curve<br />
Scroll and pan<br />
Fast scroll and pan<br />
Start mouse zoom<br />
Zoom<br />
Abort zoom operation<br />
o Not applicable in Autoscale mode Original scale<br />
t<br />
z<br />
Arrow key<br />
Alt+arrow key<br />
Enter<br />
Esc<br />
Zoom out one step<br />
Start kbd zoom<br />
Move zoom rectangle<br />
Size zoom rectangle<br />
Zoom<br />
Abort zoom operation<br />
©SpectraTime Europe Headquarters North America Sales Offices Page 18 of 25<br />
sales@spectratime.com +41.32.732.16.66 +1.512.470.3980<br />
spectratime.com
iTest+® PicoTime <strong>Manual</strong><br />
5. THEORY<br />
5.1 The Allan Deviation<br />
The most common time domain stability measure is the Allan variance (AVAR), ±σ y 2 (tau),which gives a value<br />
for the fractional frequency fluctuations as a function of averaging time, tau.<br />
It is defined as:<br />
2<br />
σ ( τ ) =<br />
y<br />
1<br />
2( M −1)<br />
M<br />
∑ − 1<br />
i=<br />
1<br />
[ y y ]<br />
i+ 1<br />
−<br />
i<br />
2<br />
Where y(i) is the ith of M fractional frequency values averaged over the measurement interval tau.<br />
In terms of phase data, the Allan variance may be calculated as:<br />
N<br />
∑ − 2<br />
2 1<br />
2<br />
σ<br />
y<br />
( τ ) =<br />
[ x<br />
+<br />
−<br />
+<br />
+ ]<br />
2 i 2<br />
2xi<br />
1<br />
xi<br />
2( N − 2) τ i=<br />
1<br />
Where x(i) is the ith of the N=M+1 phase values spaced by the measurement interval tau.<br />
The result is usually expressed as the square root of the Allan variance, this will be the Allan deviation σ y (tau).<br />
5.2 Confidence Interval<br />
There is several different methods for setting the confidence intervals and errors bars in its stability analysis and<br />
plotting functions. The confidence interval for an Allan variance estimate depends not only on the Allan variance<br />
type (normal, overlapping, modified, or time) and nominal value, and on the averaging factor and number of<br />
data points, but also on the statistical confidence factor desired and the type of noise.<br />
The simplest confidence interval approximation, with no consideration of the noise type, sets the ±1σ (68%)<br />
error bars at ±σ y (tau)/√N, where N is the number of frequency data points used to calculate the Allan deviation.<br />
Picotime does not display the confidence interval. Stable 32 is more appropriate to obtain such results.<br />
©SpectraTime Europe Headquarters North America Sales Offices Page 19 of 25<br />
sales@spectratime.com +41.32.732.16.66 +1.512.470.3980<br />
spectratime.com
iTest+® PicoTime <strong>Manual</strong><br />
6. SYSTEM TESTS<br />
To measure the system noise, a low noise, high spectral purity and stable oscillator or atomic frequency<br />
standard with an output of 10MHz is used. The signal is split in two using a high quality RF power splitter and is<br />
applied to the reference input and to the F DUT input. This way, the noise of the reference and device under test<br />
are cancelled and only the noise of the PicoTime unit is measured. To obtain the best performances, the<br />
environmental condition must be ideal in term of temperature change, magnetic and electromagnetic field,<br />
vibration, ...<br />
<strong>Spectratime</strong> recommends to place PicoTime unit in a proper environmental area. Following environmental<br />
condition have to be avoided :<br />
- Fast temperature change,<br />
- Vibration and micro-vibration,<br />
- Magnetic and electromagnetic field,<br />
- Presence of an airflow,<br />
- Proximity of an RF source.<br />
The user has also to be attentive to have the best quality connections between RF input signals and the<br />
PicoTime unit.<br />
10MHz<br />
Picotime<br />
COM<br />
PC<br />
Power<br />
Supply<br />
Fig. 18 : Connections for system noise measurements<br />
The intrinsic stability of the system is characterized by a slope in approximately τ -1 with a stability at 1 second<br />
for 10MHz frequency device of σ y (1) ≅ 1E -12 .<br />
©SpectraTime Europe Headquarters North America Sales Offices Page 20 of 25<br />
sales@spectratime.com +41.32.732.16.66 +1.512.470.3980<br />
spectratime.com
iTest+® PicoTime <strong>Manual</strong><br />
Fig. 19 : System noise 1 in ideal conditions<br />
Fig. 20 : System noise 2 in ideal conditions<br />
©SpectraTime Europe Headquarters North America Sales Offices Page 21 of 25<br />
sales@spectratime.com +41.32.732.16.66 +1.512.470.3980<br />
spectratime.com
iTest+® PicoTime <strong>Manual</strong><br />
7. TYPICAL MEASUREMENT<br />
The basic connections are the following :<br />
10MHz Ref<br />
Picotime<br />
COM<br />
PC<br />
Power<br />
Supply<br />
Fig. 21 : Typical measurements connections<br />
Atomic Rubidium clock<br />
Fig. 22 : Rubidium atomic clock stability<br />
©SpectraTime Europe Headquarters North America Sales Offices Page 22 of 25<br />
sales@spectratime.com +41.32.732.16.66 +1.512.470.3980<br />
spectratime.com
iTest+® PicoTime <strong>Manual</strong><br />
State of the art Quartz Crystal Oscillator<br />
Fig. 23 : Quartz crystal oscillator stability<br />
The PicoTime system noise is visible before 4 seconds. From this measurement the Crystal oscillator stability at<br />
1 second can be extrapolated as : σ y (1) = 6.8x10 -13 .<br />
©SpectraTime Europe Headquarters North America Sales Offices Page 23 of 25<br />
sales@spectratime.com +41.32.732.16.66 +1.512.470.3980<br />
spectratime.com
iTest+® PicoTime <strong>Manual</strong><br />
8. TROUBLE SHOOTING<br />
Perform all of the following procedures before returning the unit for service. If the unit still appears to have a<br />
problem, then call <strong>Spectratime</strong> SA and request technical support. Have the serial number of your unit ready to<br />
give to a technical representative.<br />
Note: This instrument does not require periodic calibration.<br />
Check with power turned off<br />
1) Ensure the power source is turned off.<br />
2) Check for visible damage in the unit, cables, plugs and connectors.<br />
3) Ensure that all plugs and connectors are correctly installed and fastened.<br />
4) Check to determine if any input power circuit breakers have been tripped.<br />
Do not forget to check the signal level of the DUT and the 10MHz reference.<br />
Check with power on<br />
5) Connect the power supply. Check that the red LED or green LED on the unit is lit.<br />
6) Start PicoTime software and be careful about trouble shooting messages.<br />
• Frequency out of range<br />
The frequency of the reference must be 10MHz inclusively. On the other hand the DUT frequency must be in<br />
the range of 1MHz to 30MHz. If the DUT frequency exceeds this range, the following message will appear:<br />
Frequency out of range<br />
• Wait the locking<br />
The output quartz filter needs several seconds to be locked. The green LED in the front panel is lit when the<br />
filter is locked. On the other hand the red LED is lit when the filter is not locked.<br />
During the period of locking the following message will appear:<br />
XTAL filter unlocked, wait…<br />
If the filter never locked, try to exit and restart the initialization. If the lock indicator do not become green, start a<br />
Non-Filtered measurement to check if the relative DUT frequency deviation is greater than
iTest+® PicoTime <strong>Manual</strong><br />
9. GLOSSARY<br />
Adobe Acrobat Reader A software program that enables people to read and print files saved in the PDF format.<br />
Allan Deviation Square root of Allan Variance: It indicates the typical deviation from one measurement to the<br />
next.<br />
DDS<br />
DUT<br />
FSMS<br />
IF<br />
BP<br />
LP<br />
XTAL<br />
.PDF<br />
Stable32<br />
Direct Digital Synthesizer<br />
Device Under Test<br />
Frequency Stability Measurement System<br />
Intermediate Frequency<br />
Band Pass filter<br />
Low Pass filter<br />
Quartz crystal<br />
Portable Document Format, file extension to be used by<br />
Adobe Acrobat Reader.<br />
Stability analysis software<br />
©SpectraTime Europe Headquarters North America Sales Offices Page 25 of 25<br />
sales@spectratime.com +41.32.732.16.66 +1.512.470.3980<br />
spectratime.com