annual report - Kendrion
annual report - Kendrion
annual report - Kendrion
You also want an ePaper? Increase the reach of your titles
YUMPU automatically turns print PDFs into web optimized ePapers that Google loves.
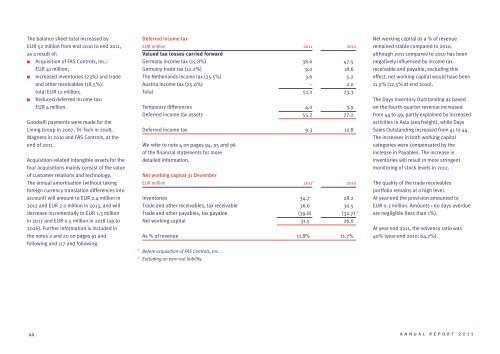
The balance sheet total increased by<br />
EUR 52 million from end 2010 to end 2011,<br />
as a result of:<br />
z Acquisition of FAS Controls, Inc.:<br />
EUR 41 million;<br />
z Increased inventories (23%) and trade<br />
and other receivables (18.5%):<br />
total EUR 12 million;<br />
z Reduced deferred income tax:<br />
EUR 4 million.<br />
Goodwill payments were made for the<br />
Linnig Group in 2007, Tri-Tech in 2008,<br />
Magneta in 2010 and FAS Controls, at the<br />
end of 2011.<br />
Acquisition-related intangible assets for the<br />
four acquisitions mainly consist of the value<br />
of customer relations and technology.<br />
The <strong>annual</strong> amortisation (without taking<br />
foreign currency translation differences into<br />
account) will amount to EUR 2.4 million in<br />
2012 and EUR 2.0 million in 2013, and will<br />
decrease incrementally to EUR 1.3 million<br />
in 2017 and EUR 0.5 million in 2018 (up to<br />
2026). Further information is included in<br />
the notes 2 and 20 on pages 91 and<br />
following and 117 and following.<br />
Deferred income tax<br />
EUR million<br />
Valued tax losses carried forward<br />
Germany income tax (15.8%)<br />
Germany trade tax (12.2%)<br />
The Netherlands income tax (25.5%)<br />
Austria income tax (25.0%)<br />
Total<br />
Temporary differences<br />
Deferred income tax assets<br />
Deferred income tax<br />
We refer to note 4 on pages 94, 95 and 96<br />
of the financial statements for more<br />
detailed information.<br />
Net working capital 31 December<br />
EUR million<br />
Inventories<br />
Trade and other receivables, tax receivable<br />
Trade and other payables, tax payable<br />
2011<br />
38.6<br />
9.0<br />
3.6<br />
–<br />
51.2<br />
4.0<br />
55.2<br />
9.3<br />
1<br />
2011<br />
34.7<br />
36.6<br />
(39.8)<br />
2010<br />
47.5<br />
18.6<br />
5.2<br />
2.0<br />
73.3<br />
3.9<br />
77.2<br />
12.8<br />
2010<br />
28.2<br />
30.5<br />
(32.7) Net working capital as a % of revenue<br />
remained stable compared to 2010,<br />
although 2011 compared to 2010 has been<br />
negatively influenced by income tax<br />
receivable and payable; excluding this<br />
effect, net working capital would have been<br />
11.9% (12.5% at end 2010).<br />
The Days Inventory Outstanding as based<br />
on the fourth-quarter revenue increased<br />
from 44 to 49, partly explained by increased<br />
activities in Asia (sea freight), while Days<br />
Sales Outstanding increased from 41 to 44.<br />
The increases in both working capital<br />
categories were compensated by the<br />
increase in Payables. The increase in<br />
inventories will result in more stringent<br />
monitoring of stock levels in 2012.<br />
The quality of the trade receivables<br />
portfolio remains at a high level.<br />
At year-end the provision amounted to<br />
EUR 0.3 million. Amounts › 60 days overdue<br />
are negligible (less than 1%).<br />
Net working capital 31.5 26.0<br />
At year-end 2011, the solvency ratio was<br />
As % of revenue 11.8% 11.7% 40% (year-end 2010: 64.7%).<br />
1 Before acquisition of FAS Controls, Inc.<br />
2 Excluding an earn-out liability.<br />
44<br />
<strong>annual</strong> <strong>report</strong> 2011


