Supaul Bihar Annual District Plan 2011-12 - nrcddp
Supaul Bihar Annual District Plan 2011-12 - nrcddp
Supaul Bihar Annual District Plan 2011-12 - nrcddp

You also want an ePaper? Increase the reach of your titles
YUMPU automatically turns print PDFs into web optimized ePapers that Google loves.
CHAPTER VH<br />
WOMEN COMPONENT OF DISTRICT ANNUAL PLAN: <strong>2011</strong> - <strong>12</strong><br />
WOMEN COMPONENT OF DISTRICT ANNUAL PLAN<br />
INTRODUCTION:<br />
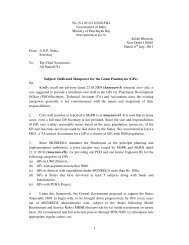
The Women population of the district is 830371<br />
constituting 47.9 % of the total population of the<br />
district. The literacy among women is 16.38 %<br />
• %Male<br />
against the overall literacy rate of 37.3 % as per 2001<br />
• % Female<br />
Census. Lack of awareness among the women folk<br />
about their civil rights and lack of desired economic<br />
development make them vulnerable to social<br />
discrimination. They are counted as socially,<br />
educationally and economically disadvantaged group<br />
of the society. Spread of literacy and education among the women is another positive indication of development.<br />
Besides the regulatory measures, beneficiary oriented programmes are being taken up necessary flow of benefits<br />
to this section of the district, for their socio economic development.<br />
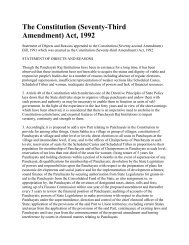
<strong>Supaul</strong> has sex ratio in favour<br />
of male with total 920 female<br />
per 1000 male. If we look at the<br />
actual number in the total<br />
population of 17,32,578; male<br />
population is 9, 02,207 and<br />
female population is 8,30,371.<br />
In percentage terms it is 52.1 %<br />
and 47.9% respectively.<br />
950<br />
Sex ratio<br />
Females per lOOO males<br />
UBS"<br />
—'966. 564...,,,.<br />
" r * ss ~—-ft&a<br />
.1005<br />
The sex ratio in the country as<br />
well as in the district shows a<br />
decreasing trend, which is<br />
1901 1911 1921 1931 1941 1951 1961 1971 1981 1991 2001<br />
evidently depicted in the given<br />
graph. The only thing of relief is that after the census of 1991 to 2001 it has shown some improvement, but still it is<br />
alarming.