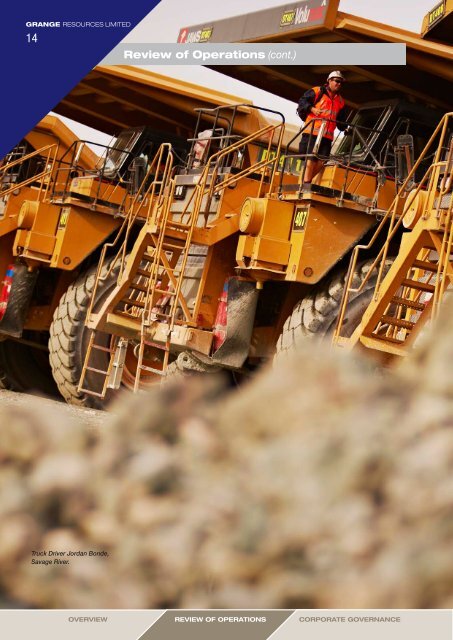
GRANGE RESOURCES LIMITED 14 Review of Operations (cont.) Truck Driver Jordan Bonde, Savage River. Overview Review Of Operations Corporate Governance
<strong>2011</strong> ANNUAL REPORT 15 Pellet production and sales Pellet production for the year ended 31 December <strong>2011</strong> was 1.98 million tonnes with the lower annualised production rate arising as a result of the June 2010 rock slide at Savage River which temporarily affected ore supply. Pellet sales were 1.7 million tonnes. During the year the average price received for iron ore pellets was A206.02 per tonne, a 30% increase from A$158.47 per tonne for the six month period ended 31 December 2010. In March <strong>2011</strong>, agreement was reached with customers, on a pricing mechanism designed to replace the Benchmark system that was in place prior to <strong>April</strong> 2010. As a result of this agreement, we received $52.1 million, being the difference between what was paid for shipments in 2010 under an interim pricing agreement and what was due using the agreed pricing mechanism. <strong>Grange</strong> forecasts production of approximately 2.3 to 2.4 million tonnes of concentrate in <strong>2012</strong> and will be able to maintain pellet production to meet all contracted sales requirements during this period. Unit costs rose during <strong>2011</strong> primarily as a result of the reduced pellet production. Regaining access to the main ore zone in the North Pit during the final quarter of <strong>2011</strong> resulted in production levels increasing and C1 unit costs of pellet production falling to below A$90 per tonne. 12 Months 12 Months 6 Months December <strong>2011</strong> December 2010 December 2010 PRODUCTION STATISTICS Mine - Volumes (‘000) Waste Mined (BCM) 13,935 15,935 7,448 Ore Mined (BCM) 1,693 1,214 579 Total Mined (BCM) 15,628 17,149 8,027 Strip Ratio (Ore To Waste) 8:1 13:1 13:1 Concentrator - Volumes (‘000) Ore Crushed (t) 5,766 5,752 2,909 Ore Milled (t) (wet) 5,840 5,621 2,791 Weight recovery (dry) (%DTR) 36.4% 42.8% 39.9% Concentrate Produced (t) 2,019 2,288 1,058 Pellet Plant - Volumes (‘000) Pellets Produced (t) 1,978 2,205 1,000 Concentrate Stockpile (t) 1 11 11 Pellet Stockpile (t) 351 69 69 Sales - Volumes (‘000) Pellets (t) 1,696 2,344 1,175 Concentrate (t) 11 18 18 Chips (t) 66 84 37 Total Sales Volume (t) 1,773 2,446 1,230 SALES REVENUE, CASH OPERATING COSTS (C1) AND OPERATING MARGIN SALES REVENUE Sales of Iron Ore (A$) $410,432 $311,145 $193,334 Average Pellet Price Received (A$/t) $206.02 $127.68 $158.47 CASH OPERATING COSTS (C1) Cash Operating Costs (C1) (A$/t) * $111.68 $81.20 $88.20 Operating Margin (A$/t) $94.34 $46.48 $70.27 * Cash Operating Costs (C1) are the cash costs associated with producing iron ore pellets without allowance for deferred mining and stockpile movements, and also exclude royalties, depreciation and amortisation costs. Directors’ <strong>Report</strong> Financial Statements Shareholder information