2011 Annual Report (3 April 2012) - Grange Resources
2011 Annual Report (3 April 2012) - Grange Resources
2011 Annual Report (3 April 2012) - Grange Resources

Create successful ePaper yourself
Turn your PDF publications into a flip-book with our unique Google optimized e-Paper software.
<strong>2011</strong> ANNUAL REPORT<br />
15<br />
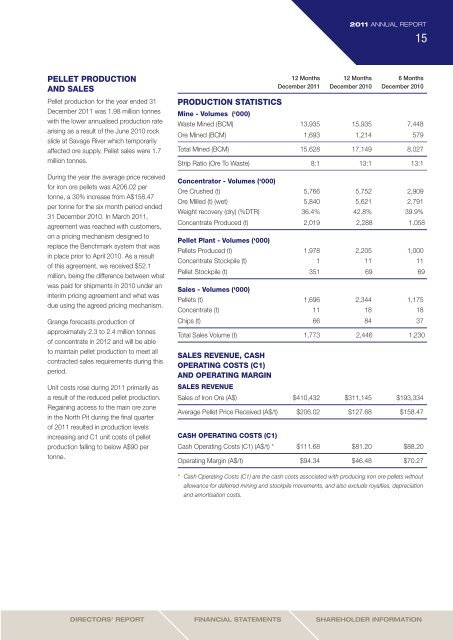
Pellet production<br />
and sales<br />
Pellet production for the year ended 31<br />
December <strong>2011</strong> was 1.98 million tonnes<br />
with the lower annualised production rate<br />
arising as a result of the June 2010 rock<br />
slide at Savage River which temporarily<br />
affected ore supply. Pellet sales were 1.7<br />
million tonnes.<br />
During the year the average price received<br />
for iron ore pellets was A206.02 per<br />
tonne, a 30% increase from A$158.47<br />
per tonne for the six month period ended<br />
31 December 2010. In March <strong>2011</strong>,<br />
agreement was reached with customers,<br />
on a pricing mechanism designed to<br />
replace the Benchmark system that was<br />
in place prior to <strong>April</strong> 2010. As a result<br />
of this agreement, we received $52.1<br />
million, being the difference between what<br />
was paid for shipments in 2010 under an<br />
interim pricing agreement and what was<br />
due using the agreed pricing mechanism.<br />
<strong>Grange</strong> forecasts production of<br />
approximately 2.3 to 2.4 million tonnes<br />
of concentrate in <strong>2012</strong> and will be able<br />
to maintain pellet production to meet all<br />
contracted sales requirements during this<br />
period.<br />
Unit costs rose during <strong>2011</strong> primarily as<br />
a result of the reduced pellet production.<br />
Regaining access to the main ore zone<br />
in the North Pit during the final quarter<br />
of <strong>2011</strong> resulted in production levels<br />
increasing and C1 unit costs of pellet<br />
production falling to below A$90 per<br />
tonne.<br />
12 Months 12 Months 6 Months<br />
December <strong>2011</strong> December 2010 December 2010<br />
PRODUCTION STATISTICS<br />
Mine - Volumes (‘000)<br />
Waste Mined (BCM) 13,935 15,935 7,448<br />
Ore Mined (BCM) 1,693 1,214 579<br />
Total Mined (BCM) 15,628 17,149 8,027<br />
Strip Ratio (Ore To Waste) 8:1 13:1 13:1<br />
Concentrator - Volumes (‘000)<br />
Ore Crushed (t) 5,766 5,752 2,909<br />
Ore Milled (t) (wet) 5,840 5,621 2,791<br />
Weight recovery (dry) (%DTR) 36.4% 42.8% 39.9%<br />
Concentrate Produced (t) 2,019 2,288 1,058<br />
Pellet Plant - Volumes (‘000)<br />
Pellets Produced (t) 1,978 2,205 1,000<br />
Concentrate Stockpile (t) 1 11 11<br />
Pellet Stockpile (t) 351 69 69<br />
Sales - Volumes (‘000)<br />
Pellets (t) 1,696 2,344 1,175<br />
Concentrate (t) 11 18 18<br />
Chips (t) 66 84 37<br />
Total Sales Volume (t) 1,773 2,446 1,230<br />
SALES REVENUE, CASH<br />
OPERATING COSTS (C1)<br />
AND OPERATING MARGIN<br />
SALES REVENUE<br />
Sales of Iron Ore (A$) $410,432 $311,145 $193,334<br />
Average Pellet Price Received (A$/t) $206.02 $127.68 $158.47<br />
CASH OPERATING COSTS (C1)<br />
Cash Operating Costs (C1) (A$/t) * $111.68 $81.20 $88.20<br />
Operating Margin (A$/t) $94.34 $46.48 $70.27<br />
* Cash Operating Costs (C1) are the cash costs associated with producing iron ore pellets without<br />
allowance for deferred mining and stockpile movements, and also exclude royalties, depreciation<br />
and amortisation costs.<br />
Directors’ <strong>Report</strong><br />
Financial Statements<br />
Shareholder information