2011 Annual Report (3 April 2012) - Grange Resources
2011 Annual Report (3 April 2012) - Grange Resources
2011 Annual Report (3 April 2012) - Grange Resources

You also want an ePaper? Increase the reach of your titles
YUMPU automatically turns print PDFs into web optimized ePapers that Google loves.
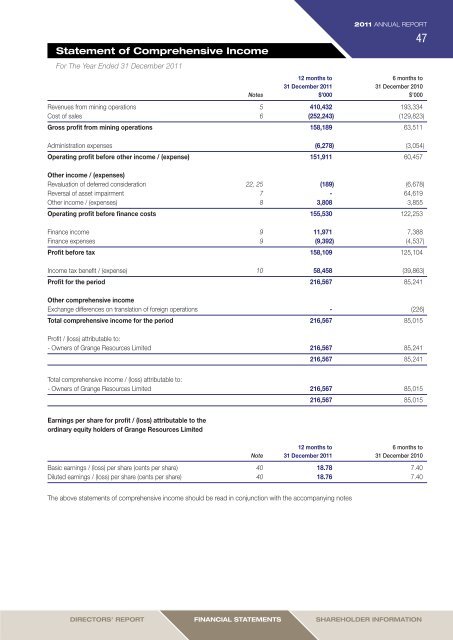
Statement of Comprehensive Income<br />
For The Year Ended 31 December <strong>2011</strong><br />
<strong>2011</strong> ANNUAL REPORT<br />
47<br />
12 months to 6 months to<br />
31 December <strong>2011</strong> 31 December 2010<br />
Notes $’000 $’000<br />
Revenues from mining operations 5 410,432 193,334<br />
Cost of sales 6 (252,243) (129,823)<br />
Gross profit from mining operations 158,189 63,511<br />
Administration expenses (6,278) (3,054)<br />
Operating profit before other income / (expense) 151,911 60,457<br />
Other income / (expenses)<br />
Revaluation of deferred consideration 22, 25 (189) (6,678)<br />
Reversal of asset impairment 7 - 64,619<br />
Other income / (expenses) 8 3,808 3,855<br />
Operating profit before finance costs 155,530 122,253<br />
Finance income 9 11,971 7,388<br />
Finance expenses 9 (9,392) (4,537)<br />
Profit before tax 158,109 125,104<br />
Income tax benefit / (expense) 10 58,458 (39,863)<br />
Profit for the period 216,567 85,241<br />
Other comprehensive income<br />
Exchange differences on translation of foreign operations - (226)<br />
Total comprehensive income for the period 216,567 85,015<br />
Profit / (loss) attributable to:<br />
- Owners of <strong>Grange</strong> <strong>Resources</strong> Limited 216,567 85,241<br />
216,567 85,241<br />
Total comprehensive income / (loss) attributable to:<br />
- Owners of <strong>Grange</strong> <strong>Resources</strong> Limited 216,567 85,015<br />
216,567 85,015<br />
Earnings per share for profit / (loss) attributable to the<br />
ordinary equity holders of <strong>Grange</strong> <strong>Resources</strong> Limited<br />
12 months to 6 months to<br />
Note 31 December <strong>2011</strong> 31 December 2010<br />
Basic earnings / (loss) per share (cents per share) 40 18.78 7.40<br />
Diluted earnings / (loss) per share (cents per share) 40 18.76 7.40<br />
The above statements of comprehensive income should be read in conjunction with the accompanying notes<br />
DirectorS’ <strong>Report</strong><br />
Financial Statements<br />
Shareholder information