Connect for the Month of March 2007 - Birla Sun Life Mutual Fund
Connect for the Month of March 2007 - Birla Sun Life Mutual Fund
Connect for the Month of March 2007 - Birla Sun Life Mutual Fund

You also want an ePaper? Increase the reach of your titles
YUMPU automatically turns print PDFs into web optimized ePapers that Google loves.
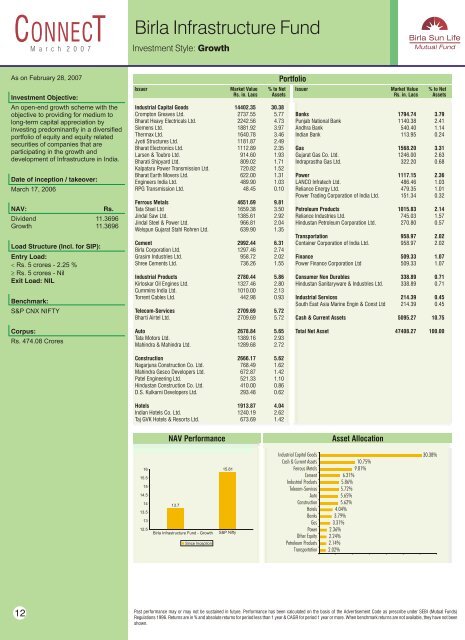
<strong>Birla</strong> Infrastructure <strong>Fund</strong><br />
M a r c h 2 0 0 7<br />
Investment Style: Growth<br />
As on February 28, <strong>2007</strong><br />
Investment Objective:<br />
An open-end growth scheme with <strong>the</strong><br />
objective to providing <strong>for</strong> medium to<br />
long-term capital appreciation by<br />
investing predominantly in a diversified<br />
portfolio <strong>of</strong> equity and equity related<br />
securities <strong>of</strong> companies that are<br />
participating in <strong>the</strong> growth and<br />
development <strong>of</strong> Infrastructure in India.<br />
Date <strong>of</strong> inception / takeover:<br />
<strong>March</strong> 17, 2006<br />
NAV:<br />
Rs.<br />
Dividend 11.3696<br />
Growth 11.3696<br />
Load Structure (Incl. <strong>for</strong> SIP):<br />
Entry Load:<br />
< Rs. 5 crores - 2.25 %<br />
³ Rs. 5 crores - Nil<br />
Exit Load: NIL<br />
Benchmark:<br />
S&P CNX NIFTY<br />
Issuer Market Value % to Net<br />
Rs. in. Lacs Assets<br />
Industrial Capital Goods 14402.35 30.38<br />
Crompton Greaves Ltd. 2737.55 5.77<br />
Bharat Heavy Electricals Ltd. 2242.56 4.73<br />
Siemens Ltd. 1881.92 3.97<br />
Thermax Ltd. 1640.78 3.46<br />
Jyoti Structures Ltd. 1181.87 2.49<br />
Bharat Electronics Ltd. 1112.89 2.35<br />
Larsen & Toubro Ltd. 914.60 1.93<br />
Bharati Shipyard Ltd. 809.02 1.71<br />
Kalpataru Power Transmission Ltd. 720.82 1.52<br />
Bharat Earth Movers Ltd. 622.00 1.31<br />
Engineers India Ltd. 489.90 1.03<br />
RPG Transmission Ltd. 48.45 0.10<br />
Ferrous Metals 4651.69 9.81<br />
Tata Steel Ltd 1659.38 3.50<br />
Jindal Saw Ltd. 1385.61 2.92<br />
Jindal Steel & Power Ltd. 966.81 2.04<br />
Welspun Gujarat Stahl Rohren Ltd. 639.90 1.35<br />
Cement 2992.44 6.31<br />
<strong>Birla</strong> Corporation Ltd. 1297.46 2.74<br />
Grasim Industries Ltd. 958.72 2.02<br />
Shree Cements Ltd. 736.26 1.55<br />
Industrial Products 2780.44 5.86<br />
Kirloskar Oil Engines Ltd. 1327.46 2.80<br />
Cummins India Ltd. 1010.00 2.13<br />
Torrent Cables Ltd. 442.98 0.93<br />
Telecom-Services 2709.69 5.72<br />
Bharti Airtel Ltd. 2709.69 5.72<br />
Portfolio<br />
Issuer Market Value % to Net<br />
Rs. in. Lacs Assets<br />
Banks 1794.74 3.79<br />
Punjab National Bank 1140.38 2.41<br />
Andhra Bank 540.40 1.14<br />
Indian Bank 113.95 0.24<br />
Gas 1568.20 3.31<br />
Gujarat Gas Co. Ltd. 1246.00 2.63<br />
Indraprastha Gas Ltd. 322.20 0.68<br />
Power 1117.15 2.36<br />
LANCO Infratech Ltd. 486.46 1.03<br />
Reliance Energy Ltd. 479.35 1.01<br />
Power Trading Corporation <strong>of</strong> India Ltd. 151.34 0.32<br />
Petroleum Products 1015.83 2.14<br />
Reliance Industries Ltd. 745.03 1.57<br />
Hindustan Petroleum Corporation Ltd. 270.80 0.57<br />
Transportation 958.97 2.02<br />
Container Corporation <strong>of</strong> India Ltd. 958.97 2.02<br />
Finance 509.33 1.07<br />
Power Finance Corporation Ltd 509.33 1.07<br />
Consumer Non Durables 338.89 0.71<br />
Hindustan Sanitaryware & Industries Ltd. 338.89 0.71<br />
Industrial Services 214.39 0.45<br />
South East Asia Marine Engin & Const Ltd 214.39 0.45<br />
Cash & Current Assets 5095.27 10.75<br />
Corpus:<br />
Rs. 474.08 Crores<br />
Auto 2678.84 5.65<br />
Tata Motors Ltd. 1389.16 2.93<br />
Mahindra & Mahindra Ltd. 1289.68 2.72<br />
Construction 2666.17 5.62<br />
Nagarjuna Construction Co. Ltd. 768.49 1.62<br />
Mahindra Gesco Developers Ltd. 672.87 1.42<br />
Patel Engineering Ltd. 521.33 1.10<br />
Hindustan Construction Co. Ltd. 410.00 0.86<br />
D.S. Kulkarni Developers Ltd. 293.48 0.62<br />
Hotels 1913.87 4.04<br />
Indian Hotels Co. Ltd. 1240.19 2.62<br />
Taj GVK Hotels & Resorts Ltd. 673.69 1.42<br />
Total Net Asset 47408.27 100.00<br />
NAV Per<strong>for</strong>mance<br />
Asset Allocation<br />
16<br />
15.5<br />
15<br />
14.5<br />
14<br />
13.5<br />
13<br />
12.5<br />
13.7<br />
<strong>Birla</strong> Infrastructure <strong>Fund</strong> - Growth<br />
Since Inception<br />
15.81<br />
S&P Nifty<br />
Industrial Capital Goods<br />
Cash & Current Assets<br />
Ferrous Metals<br />
Cement<br />
Industrial Products<br />
Telecom-Services<br />
Auto<br />
Construction<br />
Hotels<br />
Banks<br />
Gas<br />
Power<br />
O<strong>the</strong>r Equity<br />
Petroleum Products<br />
Transportation<br />
10.75%<br />
9.81%<br />
6.31%<br />
5.86%<br />
5.72%<br />
5.65%<br />
5.62%<br />
4.04%<br />
3.79%<br />
3.31%<br />
2.36%<br />
2.24%<br />
2.14%<br />
2.02%<br />
30.38%<br />
12<br />
Past per<strong>for</strong>mance may or may not be sustained in future. Per<strong>for</strong>mance has been calculated on <strong>the</strong> basis <strong>of</strong> <strong>the</strong> Advertisement Code as prescribe under SEBI (<strong>Mutual</strong> <strong>Fund</strong>s)<br />
Regulations 1996. Returns are in % and absolute returns <strong>for</strong> period less than 1 year & CAGR <strong>for</strong> period 1 year or more. When benchmark returns are not available, <strong>the</strong>y have not been<br />
shown.