Connect for the Month of March 2007 - Birla Sun Life Mutual Fund
Connect for the Month of March 2007 - Birla Sun Life Mutual Fund
Connect for the Month of March 2007 - Birla Sun Life Mutual Fund

Create successful ePaper yourself
Turn your PDF publications into a flip-book with our unique Google optimized e-Paper software.
M a r c h 2 0 0 7<br />
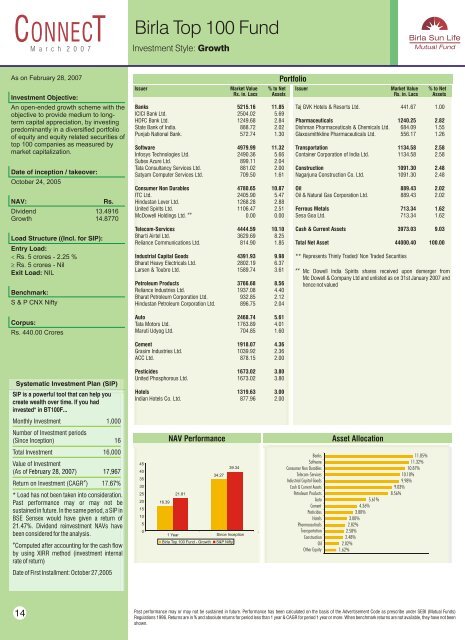
<strong>Birla</strong> Top 100 <strong>Fund</strong><br />
Investment Style: Growth<br />
As on February 28, <strong>2007</strong><br />
Investment Objective:<br />
An open-ended growth scheme with <strong>the</strong><br />
objective to provide medium to longterm<br />
capital appreciation, by investing<br />
predominantly in a diversified portfolio<br />
<strong>of</strong> equity and equity related securities <strong>of</strong><br />
top 100 companies as measured by<br />
market capitalization.<br />
Date <strong>of</strong> inception / takeover:<br />
October 24, 2005<br />
NAV:<br />
Rs.<br />
Dividend 13.4916<br />
Growth 14.8770<br />
Load Structure ((Incl. <strong>for</strong> SIP):<br />
Entry Load:<br />
< Rs. 5 crores - 2.25 %<br />
³ Rs. 5 crores - Nil<br />
Exit Load: NIL<br />
Benchmark:<br />
S & P CNX Nifty<br />
Corpus:<br />
Rs. 440.00 Crores<br />
Issuer Market Value % to Net<br />
Rs. in. Lacs Assets<br />
Banks 5215.16 11.85<br />
ICICI Bank Ltd. 2504.02 5.69<br />
HDFC Bank Ltd. 1249.68 2.84<br />
State Bank <strong>of</strong> India. 888.72 2.02<br />
Punjab National Bank. 572.74 1.30<br />
S<strong>of</strong>tware 4979.99 11.32<br />
Infosys Technologies Ltd. 2490.36 5.66<br />
Subex Azure Ltd. 899.11 2.04<br />
Tata Consultancy Services Ltd. 881.02 2.00<br />
Satyam Computer Services Ltd. 709.50 1.61<br />
Consumer Non Durables 4780.65 10.87<br />
ITC Ltd. 2405.90 5.47<br />
Hindustan Lever Ltd. 1268.28 2.88<br />
United Spirits Ltd. 1106.47 2.51<br />
##<br />
McDowell Holdings Ltd. 0.00 0.00<br />
Telecom-Services 4444.59 10.10<br />
Bharti Airtel Ltd. 3629.69 8.25<br />
Reliance Communications Ltd. 814.90 1.85<br />
Industrial Capital Goods 4391.93 9.98<br />
Bharat Heavy Electricals Ltd. 2802.19 6.37<br />
Larsen & Toubro Ltd. 1589.74 3.61<br />
Petroleum Products 3766.68 8.56<br />
Reliance Industries Ltd. 1937.08 4.40<br />
Bharat Petroleum Corporation Ltd. 932.85 2.12<br />
Hindustan Petroleum Corporation Ltd. 896.75 2.04<br />
Auto 2468.74 5.61<br />
Tata Motors Ltd. 1763.89 4.01<br />
Maruti Udyog Ltd. 704.85 1.60<br />
Portfolio<br />
Issuer Market Value % to Net<br />
Rs. in. Lacs Assets<br />
Taj GVK Hotels & Resorts Ltd. 441.67 1.00<br />
Pharmaceuticals 1240.25 2.82<br />
Dishman Pharmaceuticals & Chemicals Ltd. 684.09 1.55<br />
Glaxosmithkline Pharmaceuticals Ltd. 556.17 1.26<br />
Transportation 1134.58 2.58<br />
Container Corporation <strong>of</strong> India Ltd. 1134.58 2.58<br />
Construction 1091.30 2.48<br />
Nagarjuna Construction Co. Ltd. 1091.30 2.48<br />
Oil 889.43 2.02<br />
Oil & Natural Gas Corporation Ltd. 889.43 2.02<br />
Ferrous Metals 713.34 1.62<br />
Sesa Goa Ltd. 713.34 1.62<br />
Cash & Current Assets 3973.03 9.03<br />
Total Net Asset 44000.40 100.00<br />
** Represents Thinly Traded/ Non Traded Securities<br />
##<br />
Mc Dowell India Spirits shares received upon demerger from<br />
Mc Dowell & Company Ltd and unlisted as on 31st January <strong>2007</strong> and<br />
hence not valued<br />
Cement 1918.07 4.36<br />
Grasim Industries Ltd. 1039.92 2.36<br />
ACC Ltd. 878.15 2.00<br />
Systematic Investment Plan (SIP)<br />
SIP is a powerful tool that can help you<br />
create wealth over time. If you had<br />
invested* in BT100F...<br />
Pesticides 1673.02 3.80<br />
United Phosphorous Ltd. 1673.02 3.80<br />
Hotels 1319.63 3.00<br />
Indian Hotels Co. Ltd. 877.96 2.00<br />
<strong>Month</strong>ly Investment 1,000<br />
Number <strong>of</strong> Investment periods<br />
(Since Inception) 16<br />
NAV Per<strong>for</strong>mance<br />
Asset Allocation<br />
Total Investment 16,000<br />
Value <strong>of</strong> Investment<br />
(As <strong>of</strong> February 28, <strong>2007</strong> ) 17,967<br />
.67<br />
#<br />
Return on Investment (CAGR ) 17 %<br />
* Load has not been taken into consideration.<br />
Past per<strong>for</strong>mance may or may not be<br />
sustained in future. In <strong>the</strong> same period, a SIP in<br />
BSE Sensex would have given a return <strong>of</strong><br />
21.47%. Dividend reinvestment NAVs have<br />
been considered <strong>for</strong> <strong>the</strong> analysis.<br />
#<br />
Computed after accounting <strong>for</strong> <strong>the</strong> cash flow<br />
by using XIRR method (investment internal<br />
rate <strong>of</strong> return)<br />
45<br />
40<br />
35<br />
30<br />
25<br />
20<br />
15<br />
10<br />
5<br />
0<br />
16.39<br />
21.81<br />
34.27<br />
39.34<br />
1 Year Since Inception<br />
<strong>Birla</strong> Top 100 <strong>Fund</strong> - Growth<br />
S&P Nifty<br />
Banks<br />
S<strong>of</strong>tware<br />
Consumer Non Durables<br />
Telecom-Services<br />
Industrial Capital Goods<br />
Cash & Current Assets<br />
Petroleum Products<br />
Auto<br />
Cement<br />
Pesticides<br />
Hotels<br />
Pharmaceuticals<br />
Transportation<br />
Construction<br />
Oil<br />
O<strong>the</strong>r Equity<br />
5.61%<br />
4.36%<br />
3.80%<br />
3.00%<br />
2.82%<br />
2.58%<br />
2.48%<br />
2.02%<br />
1.62%<br />
11.85%<br />
11.32%<br />
10.87%<br />
10.10%<br />
9.98%<br />
9.03%<br />
8.56%<br />
Date <strong>of</strong> First Installment: October 27,2005<br />
14<br />
Past per<strong>for</strong>mance may or may not be sustained in future. Per<strong>for</strong>mance has been calculated on <strong>the</strong> basis <strong>of</strong> <strong>the</strong> Advertisement Code as prescribe under SEBI (<strong>Mutual</strong> <strong>Fund</strong>s)<br />
Regulations 1996. Returns are in % and absolute returns <strong>for</strong> period less than 1 year & CAGR <strong>for</strong> period 1 year or more. When benchmark returns are not available, <strong>the</strong>y have not been<br />
shown.