Connect for the Month of March 2007 - Birla Sun Life Mutual Fund
Connect for the Month of March 2007 - Birla Sun Life Mutual Fund
Connect for the Month of March 2007 - Birla Sun Life Mutual Fund

Create successful ePaper yourself
Turn your PDF publications into a flip-book with our unique Google optimized e-Paper software.
M a r c h 2 0 0 7<br />
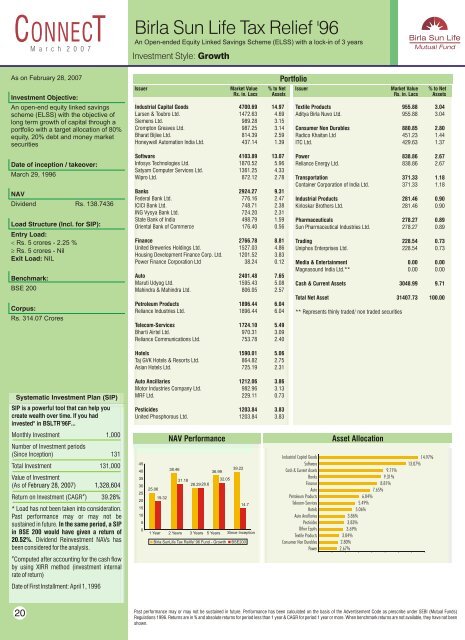
<strong>Birla</strong> <strong>Sun</strong> <strong>Life</strong> Tax Relief '96<br />
An Open-ended Equity Linked Savings Scheme (ELSS) with a lock-in <strong>of</strong> 3 years<br />
Investment Style: Growth<br />
As on February 28, <strong>2007</strong><br />
Investment Objective:<br />
An open-end equity linked savings<br />
scheme (ELSS) with <strong>the</strong> objective <strong>of</strong><br />
long term growth <strong>of</strong> capital through a<br />
portfolio with a target allocation <strong>of</strong> 80%<br />
equity, 20% debt and money market<br />
securities<br />
Date <strong>of</strong> inception / takeover:<br />
<strong>March</strong> 29, 1996<br />
NAV<br />
Dividend Rs. 138.7436<br />
Load Structure (Incl. <strong>for</strong> SIP):<br />
Entry Load:<br />
< Rs. 5 crores - 2.25 %<br />
³ Rs. 5 crores - Nil<br />
Exit Load: NIL<br />
Benchmark:<br />
BSE 200<br />
Corpus:<br />
Rs. 314.07 Crores<br />
Issuer Market Value % to Net<br />
Rs. in. Lacs Assets<br />
Industrial Capital Goods 4700.69 14.97<br />
Larsen & Toubro Ltd. 1472.63 4.69<br />
Siemens Ltd. 989.28 3.15<br />
Crompton Greaves Ltd. 987.25 3.14<br />
Bharat Bijlee Ltd. 814.39 2.59<br />
Honeywell Automation India Ltd. 437.14 1.39<br />
S<strong>of</strong>tware 4103.89 13.07<br />
Infosys Technologies Ltd. 1870.52 5.96<br />
Satyam Computer Services Ltd. 1361.25 4.33<br />
Wipro Ltd. 872.12 2.78<br />
Banks 2924.27 9.31<br />
Federal Bank Ltd. 776.16 2.47<br />
ICICI Bank Ltd. 748.71 2.38<br />
ING Vysya Bank Ltd. 724.20 2.31<br />
State Bank <strong>of</strong> India 498.79 1.59<br />
Oriental Bank <strong>of</strong> Commerce 176.40 0.56<br />
Finance 2766.78 8.81<br />
United Breweries Holdings Ltd. 1527.03 4.86<br />
Housing Development Finance Corp. Ltd. 1201.52 3.83<br />
Power Finance Corporation Ltd 38.24 0.12<br />
Auto 2401.48 7.65<br />
Maruti Udyog Ltd. 1595.43 5.08<br />
Mahindra & Mahindra Ltd. 806.05 2.57<br />
Petroleum Products 1896.44 6.04<br />
Reliance Industries Ltd. 1896.44 6.04<br />
Telecom-Services 1724.10 5.49<br />
Bharti Airtel Ltd. 970.31 3.09<br />
Reliance Communications Ltd. 753.78 2.40<br />
Portfolio<br />
Issuer Market Value % to Net<br />
Rs. in. Lacs Assets<br />
Textile Products 955.88 3.04<br />
Aditya <strong>Birla</strong> Nuvo Ltd. 955.88 3.04<br />
Consumer Non Durables 880.85 2.80<br />
Radico Khaitan Ltd 451.23 1.44<br />
ITC Ltd. 429.63 1.37<br />
Power 838.86 2.67<br />
Reliance Energy Ltd. 838.86 2.67<br />
Transportation 371.33 1.18<br />
Container Corporation <strong>of</strong> India Ltd. 371.33 1.18<br />
Industrial Products 281.46 0.90<br />
Kirloskar Bro<strong>the</strong>rs Ltd. 281.46 0.90<br />
Pharmaceuticals 278.27 0.89<br />
<strong>Sun</strong> Pharmaceutical Industries Ltd. 278.27 0.89<br />
Trading 228.54 0.73<br />
Uniphos Enterprises Ltd. 228.54 0.73<br />
Media & Entertainment 0.00 0.00<br />
Magnasound India Ltd.** 0.00 0.00<br />
Cash & Current Assets 3048.99 9.71<br />
Total Net Asset 31407.73 100.00<br />
** Represents thinly traded/ non traded securities<br />
Hotels 1590.01 5.06<br />
Taj GVK Hotels & Resorts Ltd. 864.82 2.75<br />
Asian Hotels Ltd. 725.19 2.31<br />
Systematic Investment Plan (SIP)<br />
SIP is a powerful tool that can help you<br />
create wealth over time. If you had<br />
invested* in BSLTR’96F...<br />
Auto Ancillaries 1212.06 3.86<br />
Motor Industries Company Ltd. 982.96 3.13<br />
MRF Ltd. 229.11 0.73<br />
Pesticides 1203.84 3.83<br />
United Phosphorous Ltd. 1203.84 3.83<br />
<strong>Month</strong>ly Investment 1,000<br />
Number <strong>of</strong> Investment periods<br />
(Since Inception) 131<br />
Total Investment 131,000<br />
Value <strong>of</strong> Investment<br />
(As <strong>of</strong> February 28, <strong>2007</strong>)<br />
1,328,604<br />
.28<br />
#<br />
Return on Investment (CAGR ) 39 %<br />
* Load has not been taken into consideration.<br />
Past per<strong>for</strong>mance may or may not be<br />
sustained in future. In <strong>the</strong> same period, a SIP<br />
in BSE 200 would have given a return <strong>of</strong><br />
20.52%. Dividend Reinvestment NAVs has<br />
been considered <strong>for</strong> <strong>the</strong> analysis.<br />
45<br />
40<br />
35<br />
30<br />
25<br />
20<br />
15<br />
10<br />
5<br />
0<br />
25.06<br />
19.32<br />
NAV Per<strong>for</strong>mance<br />
38.46<br />
31.18<br />
28.29 28.6<br />
36.99<br />
32.05<br />
39.22<br />
14.7<br />
1 Year 2 Years 3 Years 5 Years Since Inception<br />
<strong>Birla</strong> <strong>Sun</strong><strong>Life</strong> Tax Relife' 96 <strong>Fund</strong> - Growth<br />
BSE200<br />
Industrial Capital Goods<br />
S<strong>of</strong>tware<br />
Cash & Current Assets<br />
Banks<br />
Finance<br />
Auto<br />
Petroleum Products<br />
Telecom-Services<br />
Hotels<br />
Auto Ancillaries<br />
Pesticides<br />
O<strong>the</strong>r Equity<br />
Textile Products<br />
Consumer Non Durables<br />
Power<br />
Asset Allocation<br />
9.71%<br />
9.31%<br />
8.81%<br />
7.65%<br />
6.04%<br />
5.49%<br />
5.06%<br />
3.86%<br />
3.83%<br />
3.69%<br />
3.04%<br />
2.80%<br />
2.67%<br />
14.97%<br />
13.07%<br />
#<br />
Computed after accounting <strong>for</strong> <strong>the</strong> cash flow<br />
by using XIRR method (investment internal<br />
rate <strong>of</strong> return)<br />
Date <strong>of</strong> First Installment: April 1, 1996<br />
20<br />
Past per<strong>for</strong>mance may or may not be sustained in future. Per<strong>for</strong>mance has been calculated on <strong>the</strong> basis <strong>of</strong> <strong>the</strong> Advertisement Code as prescribe under SEBI (<strong>Mutual</strong> <strong>Fund</strong>s)<br />
Regulations 1996. Returns are in % and absolute returns <strong>for</strong> period less than 1 year & CAGR <strong>for</strong> period 1 year or more. When benchmark returns are not available, <strong>the</strong>y have not been<br />
shown.