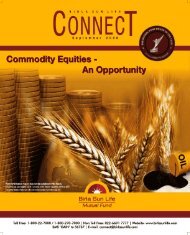
Connect for the Month of March 2007 - Birla Sun Life Mutual Fund
Connect for the Month of March 2007 - Birla Sun Life Mutual Fund
Connect for the Month of March 2007 - Birla Sun Life Mutual Fund

Create successful ePaper yourself
Turn your PDF publications into a flip-book with our unique Google optimized e-Paper software.
M a r c h 2 0 0 7<br />
India Advantage <strong>Fund</strong> Ltd.<br />
(For Non-Resident Indians and Eligible Foreign Nationals)<br />
As on February 28, <strong>2007</strong><br />
Investment Objective:<br />
An Open-ended growth scheme with<br />
<strong>the</strong> objective <strong>of</strong> long-term appreciation<br />
through investment primarily in equity<br />
related securities <strong>of</strong> companies in India<br />
that are run by efficient management,<br />
have a sustainable and robust business<br />
model and are available at reasonable<br />
valuations.<br />
Date <strong>of</strong> inception / takeover:<br />
August 8, 1996<br />
NAV:<br />
$ per Class C Share : 163.56<br />
Conversion Rate:<br />
1USD = INR 44.31<br />
Benchmark:<br />
BSE Sensex and MSCI (India)<br />
AUM:<br />
USD 151.17 Million<br />
Bloomberg Ticker Code:<br />
INDADVC MP<br />
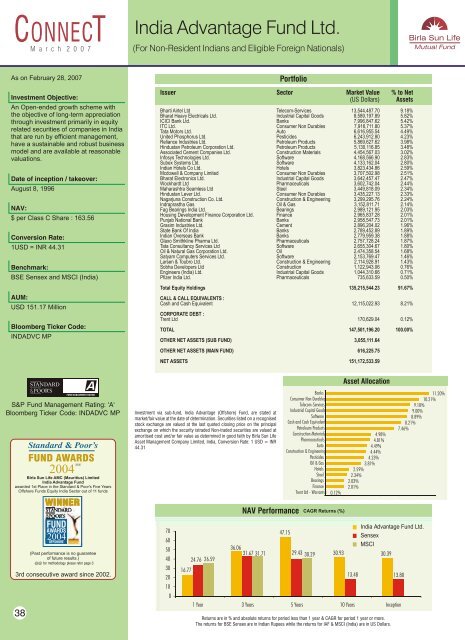
Portfolio<br />
Issuer Sector Market Value % to Net<br />
(US Dollars) Assets<br />
Bharti Airtel Ltd Telecom-Services 13,544,487.70 9.18%<br />
Bharat Heavy Electricals Ltd. Industrial Capital Goods 8,589,197.89 5.82%<br />
ICICI Bank Ltd. Banks 7,996,847.62 5.42%<br />
ITC Ltd. Consumer Non Durables 7,916,711.80 5.37%<br />
Tata Motors Ltd. Auto 6,616,955.54 4.49%<br />
United Phosphorus Ltd. Pesticides 6,243,912.80 4.23%<br />
Reliance Industries Ltd. Petroleum Products 5,869,627.62 3.98%<br />
Hindustan Petroleum Corporation Ltd. Petroleum Products 5,130,116.85 3.48%<br />
Associated Cement Companies Ltd. Construction Materials 4,454,567.03 3.02%<br />
Infosys Technologies Ltd. S<strong>of</strong>tware 4,168,566.90 2.83%<br />
Subex Systems Ltd. S<strong>of</strong>tware 4,133,162.04 2.80%<br />
Indian Hotels Co Ltd. Hotels 3,823,434.86 2.59%<br />
Mcdowell & Company Limited Consumer Non Durables 3,707,502.98 2.51%<br />
Bharat Electronics Ltd. Industrial Capital Goods 3,642,457.47 2.47%<br />
Wockhardt Ltd Pharmaceuticals 3,602,742.04 2.44%<br />
Maharashtra Seamless Ltd Steel 3,449,818.09 2.34%<br />
Hindustan Lever Ltd. Consumer Non Durables 3,435,227.13 2.33%<br />
Nagarjuna Construction Co. Ltd. Construction & Engineering 3,299,295.76 2.24%<br />
Indraprastha Gas Oil & Gas 3,152,811.71 2.14%<br />
Fag Bearings India Ltd. Bearings 2,989,121.95 2.03%<br />
Housing Development Finance Corporation Ltd. Finance 2,965,837.28 2.01%<br />
Punjab National Bank Banks 2,958,547.73 2.01%<br />
Grasim Industries Ltd. Cement 2,896,204.02 1.96%<br />
State Bank Of India Banks 2,789,452.89 1.89%<br />
Indian Overseas Bank Banks 2,779,959.38 1.88%<br />
Glaxo Smithkline Pharma Ltd. Pharmaceuticals 2,757,728.24 1.87%<br />
Tata Consultancy Services Ltd S<strong>of</strong>tware 2,655,304.67 1.80%<br />
Oil & Natural Gas Corporation Ltd. Oil 2,474,358.54 1.68%<br />
Satyam Computers Services Ltd. S<strong>of</strong>tware 2,153,769.47 1.46%<br />
Larsen & Toubro Ltd. Construction & Engineering 2,114,928.91 1.43%<br />
Sobha Developers Ltd Construction 1,122,943.06 0.76%<br />
Engineers (India) Ltd. Industrial Capital Goods 1,044,310.66 0.71%<br />
Pfizer India Ltd. Pharmaceuticals 735,633.59 0.50%<br />
Total Equity Holdings 135,215,544.23 91.67%<br />
CALL & CALL EQUIVALENTS :<br />
Cash and Cash Equivalent 12,115,022.93 8.21%<br />
CORPORATE DEBT :<br />
Trent Ltd 170,629.04 0.12%<br />
TOTAL 147,501,196.20 100.00%<br />
OTHER NET ASSETS (SUB FUND) 3,055,111.64<br />
OTHER NET ASSETS (MAIN FUND) 616,225.75<br />
NET ASSETS 151,172,533.59<br />
Asset Allocation<br />
@@<br />
2004<br />
<strong>Birla</strong> <strong>Sun</strong> <strong>Life</strong> AMC (Mauritius) Limited<br />
India Advantage <strong>Fund</strong><br />
awarded 1st Place in <strong>the</strong> Standard & Poor's Five Years<br />
Offshore <strong>Fund</strong>s Equity India Sector out <strong>of</strong> 11 funds<br />
Investment via sub-fund, India Advantage (Offshore) <strong>Fund</strong>, are stated at<br />
market/fair value at <strong>the</strong> date <strong>of</strong> determination. Securities listed on a recognised<br />
stock exchange are valued at <strong>the</strong> last quoted closing price on <strong>the</strong> principal<br />
exchange on which <strong>the</strong> security istraded Non-traded securities are valued at<br />
amortised cost and/or fair value as determined in good faith by <strong>Birla</strong> <strong>Sun</strong> <strong>Life</strong><br />
Asset Management Company Limited, India, Conversion Rate: 1 USD = INR<br />
44.31<br />
Banks<br />
Consumer Non Durables<br />
Telecom-Services<br />
Industrial Capital Goods<br />
S<strong>of</strong>tware<br />
Cash and Cash Equivalent<br />
Petroleum Products<br />
Construction Materials<br />
Pharmaceuticals<br />
Auto<br />
Construction & Engineering<br />
Pesticides<br />
Oil & Gas<br />
Hotels<br />
Steel<br />
Bearings<br />
Finance<br />
Trent Ltd - Warrants<br />
0.12%<br />
4.98%<br />
4.81%<br />
4.49%<br />
4.44%<br />
4.23%<br />
3.81%<br />
2.59%<br />
2.34%<br />
2.03%<br />
2.01%<br />
11.20%<br />
10.21%<br />
9.18%<br />
9.00%<br />
8.89%<br />
8.21%<br />
7.46%<br />
38<br />
2004<br />
(Past per<strong>for</strong>mance is no guarantee<br />
<strong>of</strong> future results.)<br />
@@ <strong>for</strong> methodology please refer page 3<br />
3rd consecutive award since 2002.<br />
70<br />
60<br />
50<br />
40<br />
30<br />
20<br />
10<br />
0<br />
16.77<br />
24.76 26.59<br />
NAV Per<strong>for</strong>mance CAGR Returns (%)<br />
47.15<br />
36.06<br />
31.67 31.71 29.43 30.29<br />
India Advantage <strong>Fund</strong> Ltd.<br />
Sensex<br />
MSCI<br />
30.93 30.39<br />
13.48 13.80<br />
1 Year 3 Years 5 Years 10 Years Inception<br />
Returns are in % and absolute returns <strong>for</strong> period less than 1 year & CAGR <strong>for</strong> period 1 year or more.<br />
The returns <strong>for</strong> BSE Sensex are in Indian Rupees while <strong>the</strong> returns <strong>for</strong> IAF & MSCI (India) are in US Dollars.