Connect for the Month of March 2007 - Birla Sun Life Mutual Fund
Connect for the Month of March 2007 - Birla Sun Life Mutual Fund
Connect for the Month of March 2007 - Birla Sun Life Mutual Fund

You also want an ePaper? Increase the reach of your titles
YUMPU automatically turns print PDFs into web optimized ePapers that Google loves.
M a r c h 2 0 0 7<br />
<strong>Birla</strong> Midcap <strong>Fund</strong><br />
Investment Style: Growth<br />
As on February 28, <strong>2007</strong><br />
Investment Objective:<br />
An Open-ended growth scheme with<br />
<strong>the</strong> objective to achieve long-term<br />
growth <strong>of</strong> capital at controlled level <strong>of</strong><br />
risk by primarily investing in midcap<br />
stocks.<br />
Date <strong>of</strong> inception / takeover:<br />
October 3, 2002<br />
NAV:<br />
Rs.<br />
Dividend 22.1268<br />
Growth 61.5240<br />
Load Structure (Incl. <strong>for</strong> SIP):<br />
Entry Load:<br />
< Rs. 5 crores - 2.25%<br />
³ Rs. 5 crores - Nil<br />
Exit Load: NIL<br />
Benchmark:<br />
CNX Midcap<br />
Corpus:<br />
Rs. 228.43 Crores<br />
Systematic Investment Plan (SIP)<br />
SIP is a powerful tool that can help you<br />
create wealth over time. If you had<br />
invested* in BMC...<br />
<strong>Month</strong>ly Investment 1,000<br />
Number <strong>of</strong> Investment periods<br />
(Since Inception) 52<br />
Total Investment 52,000<br />
Value <strong>of</strong> Investment<br />
(As <strong>of</strong> February 28, <strong>2007</strong> ) 138,465<br />
7<br />
47.92<br />
#<br />
Return on Investment (CAGR ) %<br />
* Load has not been taken into consideration.<br />
Past per<strong>for</strong>mance may or may not be<br />
sustained in future. In <strong>the</strong> same period, a SIP<br />
in CNX Midcap would have given a return <strong>of</strong><br />
39 .21%<br />
#<br />
Computed after accounting <strong>for</strong> <strong>the</strong> cash flow<br />
by using XIRR method (investment internal<br />
rate <strong>of</strong> return)<br />
Date <strong>of</strong> First Installment: November 01, 2002<br />
Issuer Market Value % to Net<br />
Rs. in. Lacs Assets<br />
Industrial Capital Goods 3321.46 14.54<br />
Bharat Bijlee Ltd. 990.37 4.34<br />
Thermax Ltd. 636.98 2.79<br />
Kalpataru Power Transmission Ltd. 540.61 2.37<br />
Crompton Greaves Ltd. 444.26 1.94<br />
Bharati Shipyard Ltd. 440.97 1.93<br />
Aban Offshore Ltd. 268.27 1.17<br />
Auto Ancillaries 2951.22 12.92<br />
Automobile Corporation <strong>of</strong> Goa Ltd. 662.00 2.90<br />
<strong>Sun</strong>daram-Clayton Ltd. 574.15 2.51<br />
Apollo Tyres Ltd. 493.39 2.16<br />
<strong>Sun</strong>daram Fasteners Ltd. 451.22 1.98<br />
Amtek India Ltd. 441.76 1.93<br />
MRF Ltd. 328.71 1.44<br />
Industrial Products 1840.07 8.06<br />
Kirloskar Oil Engines Ltd. 943.54 4.13<br />
Sintex Industries Ltd. 482.22 2.11<br />
TRF LTD 414.32 1.81<br />
Consumer Non Durables 1607.92 7.04<br />
United Spirits Ltd. 445.56 1.95<br />
Radico Khaitan Ltd 423.75 1.86<br />
Marico Industries Ltd. 407.72 1.78<br />
Glaxosmithkline Consumer Healthcare Ltd. 181.85 0.80<br />
E.I.D. Parry (India) Ltd. 149.04 0.65<br />
##<br />
McDowell Holdings Ltd. 0.00 0.00<br />
S<strong>of</strong>tware 1531.99 6.71<br />
3i Infotech Ltd. 840.87 3.68<br />
NIIT Technologies Ltd. 691.12 3.03<br />
Ferrous Metals 1477.74 6.47<br />
Jindal Saw Ltd. 766.15 3.35<br />
Welspun Gujarat Stahl Rohren Ltd. 533.25 2.33<br />
Sesa Goa Ltd. 178.34 0.78<br />
Hotels 1209.11 5.29<br />
Asian Hotels Ltd. 636.41 2.79<br />
Taj GVK Hotels & Resorts Ltd. 572.70 2.51<br />
Textile Products 1188.30 5.20<br />
Aditya <strong>Birla</strong> Nuvo Ltd. 944.11 4.13<br />
Gokaldas Exports Ltd. 244.19 1.07<br />
Cement 1014.26 4.44<br />
60<br />
50<br />
40<br />
30<br />
20<br />
10<br />
0<br />
21.65<br />
10.95<br />
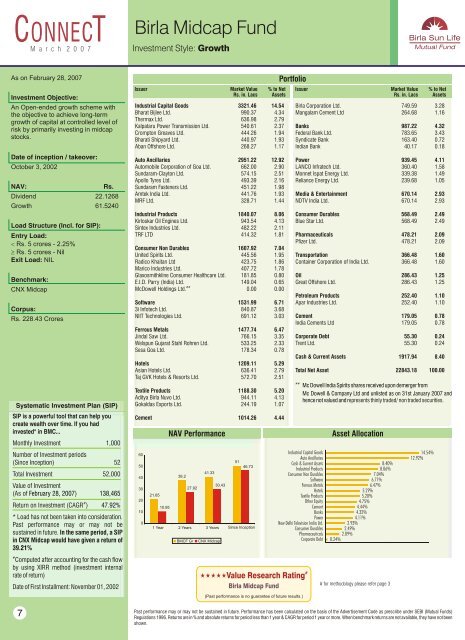
NAV Per<strong>for</strong>mance<br />
38.2<br />
27.92<br />
BMCF Gr<br />
41.33<br />
CNX Midcap<br />
30.43<br />
51<br />
46.73<br />
1 Year 2 Years 3 Years Since Inception<br />
Portfolio<br />
#<br />
Value Research Rating<br />
<strong>Birla</strong> Midcap <strong>Fund</strong><br />
(Past per<strong>for</strong>mance is no guarantee <strong>of</strong> future results.)<br />
Issuer Market Value % to Net<br />
Rs. in. Lacs Assets<br />
<strong>Birla</strong> Corporation Ltd. 749.59 3.28<br />
Mangalam Cement Ltd 264.68 1.16<br />
Banks 987.22 4.32<br />
Federal Bank Ltd. 783.65 3.43<br />
Syndicate Bank 163.40 0.72<br />
Indian Bank 40.17 0.18<br />
Power 939.45 4.11<br />
LANCO Infratech Ltd. 360.40 1.58<br />
Monnet Ispat Energy Ltd. 339.38 1.49<br />
Reliance Energy Ltd. 239.68 1.05<br />
Media & Entertainment 670.14 2.93<br />
NDTV India Ltd. 670.14 2.93<br />
Consumer Durables 568.49 2.49<br />
Blue Star Ltd. 568.49 2.49<br />
Pharmaceuticals 478.21 2.09<br />
Pfizer Ltd. 478.21 2.09<br />
Transportation 366.48 1.60<br />
Container Corporation <strong>of</strong> India Ltd. 366.48 1.60<br />
Oil 286.43 1.25<br />
Great Offshore Ltd. 286.43 1.25<br />
Petroleum Products 252.40 1.10<br />
Apar Industries Ltd. 252.40 1.10<br />
Cement 179.05 0.78<br />
India Cements Ltd 179.05 0.78<br />
Corporate Debt 55.30 0.24<br />
Trent Ltd. 55.30 0.24<br />
Cash & Current Assets 1917.94 8.40<br />
Total Net Asset 22843.18 100.00<br />
##<br />
Industrial Capital Goods<br />
Auto Ancillaries<br />
Cash & Current Assets<br />
Industrial Products<br />
Consumer Non Durables<br />
S<strong>of</strong>tware<br />
Ferrous Metals<br />
Hotels<br />
Textile Products<br />
O<strong>the</strong>r Equity<br />
Cement<br />
Banks<br />
Power<br />
New Delhi Television India Ltd.<br />
Consumer Durables<br />
Pharmaceuticals<br />
Corporate Debt<br />
Mc Dowell India Spirits shares received upon demerger from<br />
Mc Dowell & Company Ltd and unlisted as on 31st January <strong>2007</strong> and<br />
hence not valued and represents thinly traded/ non traded securities.<br />
Asset Allocation<br />
8.40%<br />
8.06%<br />
7.04%<br />
6.71%<br />
6.47%<br />
5.29%<br />
5.20%<br />
4.75%<br />
4.44%<br />
4.32%<br />
4.11%<br />
2.93%<br />
2.49%<br />
2.09%<br />
0.24%<br />
# <strong>for</strong> methodology please refer page 3<br />
14.54%<br />
12.92%<br />
Past per<strong>for</strong>mance may or may not be sustained in future. Per<strong>for</strong>mance has been calculated on <strong>the</strong> basis <strong>of</strong> <strong>the</strong> Advertisement Code as prescribe under SEBI (<strong>Mutual</strong> <strong>Fund</strong>s)<br />
Regulations 1996. Returns are in % and absolute returns <strong>for</strong> period less than 1 year & CAGR <strong>for</strong> period 1 year or more. When benchmark returns are not available, <strong>the</strong>y have not been<br />
shown.