4th International Conference on Principles and Practices ... - MADOC
4th International Conference on Principles and Practices ... - MADOC
4th International Conference on Principles and Practices ... - MADOC

You also want an ePaper? Increase the reach of your titles
YUMPU automatically turns print PDFs into web optimized ePapers that Google loves.
LCOM1 LCOM2 LCOM5 ICH<br />
Min. 0.0 0.0 0.0000 -3887.0<br />
1st Qu. 2.0 0.0 0.5000 -10.0<br />
Median 11.0 6.0 0.8000 -2.0<br />
Mean 185.5 135.5 0.7063 -20.5<br />
3rd Qu. 52.0 34.0 0.9444 0.0<br />
Max. 110902.0 94039.0 2.0000 0.0<br />
Table 1: Summary of the values for the metrics applied<br />
to 4836 of the classes from the DaCapo suite.<br />
This table shows the minimum, maximum <strong>and</strong> mean<br />
data values, as well as those at the first, sec<strong>on</strong>d (median)<br />
<strong>and</strong> third quartiles.<br />
LCOM1 LCOM2 LCOM5 ICH<br />
LCOM1 1.0 0.8597 0.5305 -0.7439<br />
LCOM2 0.8597 1.0 0.6453 -0.6463<br />
LCOM5 0.5305 0.6453 1.0 -0.3739<br />
ICH -0.7439 -0.6463 -0.3739 1.0<br />
Table 2: Spearman’s ρ statistic for each pairing of<br />
the four metrics. This statistic compares data sets <strong>on</strong><br />
a rank basis, with values near 1.0 or -1.0 indicating<br />
a str<strong>on</strong>g positive or negative correlati<strong>on</strong>.<br />
Percent of Total<br />
Percent of Total<br />
60<br />
40<br />
20<br />
0<br />
60<br />
40<br />
20<br />
0<br />
0 100 200 300 400 500<br />
LCOM1 (up to 95% percentile)<br />
by the LCOM metrics. The values of ICH are thus all<br />
negative integers. That the values shown in Table 1 all fall<br />
within these theoretical bounds provides a coarse-grained<br />
validati<strong>on</strong> of our implementati<strong>on</strong>.<br />
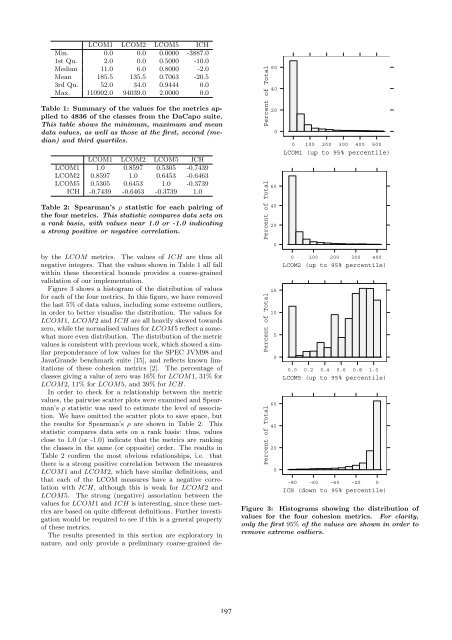
Figure 3 shows a histogram of the distributi<strong>on</strong> of values<br />
for each of the four metrics. In this figure, we have removed<br />
the last 5% of data values, including some extreme outliers,<br />
in order to better visualise the distributi<strong>on</strong>. The values for<br />
LCOM1, LCOM2 <strong>and</strong> ICH are all heavily skewed towards<br />
zero, while the normalised values for LCOM5 reflect a somewhat<br />
more even distributi<strong>on</strong>. The distributi<strong>on</strong> of the metric<br />
values is c<strong>on</strong>sistent with previous work, which showed a similar<br />
prep<strong>on</strong>derance of low values for the SPEC JVM98 <strong>and</strong><br />
JavaGr<strong>and</strong>e benchmark suite [15], <strong>and</strong> reflects known limitati<strong>on</strong>s<br />
of these cohesi<strong>on</strong> metrics [2]. The percentage of<br />
classes giving a value of zero was 16% for LCOM1, 31% for<br />
LCOM2, 11% for LCOM5, <strong>and</strong> 39% for ICH.<br />
In order to check for a relati<strong>on</strong>ship between the metric<br />
values, the pairwise scatter plots were examined <strong>and</strong> Spearman’s<br />
ρ statistic was used to estimate the level of associati<strong>on</strong>.<br />
We have omitted the scatter plots to save space, but<br />
the results for Spearman’s ρ are shown in Table 2. This<br />
statistic compares data sets <strong>on</strong> a rank basis: thus, values<br />
close to 1.0 (or -1.0) indicate that the metrics are ranking<br />
the classes in the same (or opposite) order. The results in<br />
Table 2 c<strong>on</strong>firm the most obvious relati<strong>on</strong>ships, i.e. that<br />
there is a str<strong>on</strong>g positive correlati<strong>on</strong> between the measures<br />
LCOM1 <strong>and</strong> LCOM2, which have similar definiti<strong>on</strong>s, <strong>and</strong><br />
that each of the LCOM measures have a negative correlati<strong>on</strong><br />
with ICH, although this is weak for LCOM2 <strong>and</strong><br />
LCOM5. The str<strong>on</strong>g (negative) associati<strong>on</strong> between the<br />
values for LCOM1 <strong>and</strong> ICH is interesting, since these metrics<br />
are based <strong>on</strong> quite different definiti<strong>on</strong>s. Further investigati<strong>on</strong><br />
would be required to see if this is a general property<br />
of these metrics.<br />
The results presented in this secti<strong>on</strong> are exploratory in<br />
nature, <strong>and</strong> <strong>on</strong>ly provide a preliminary coarse-grained de-<br />
Percent of Total<br />
Percent of Total<br />
15<br />
10<br />
5<br />
0<br />
60<br />
40<br />
20<br />
0<br />
0 100 200 300 400<br />
LCOM2 (up to 95% percentile)<br />
0.0 0.2 0.4 0.6 0.8 1.0<br />
LCOM5 (up to 95% percentile)<br />
−80 −60 −40 −20 0<br />
ICH (down to 95% percentile)<br />
Figure 3: Histograms showing the distributi<strong>on</strong> of<br />
values for the four cohesi<strong>on</strong> metrics. For clarity,<br />
<strong>on</strong>ly the first 95% of the values are shown in order to<br />
remove extreme outliers.<br />
197