4th International Conference on Principles and Practices ... - MADOC
4th International Conference on Principles and Practices ... - MADOC
4th International Conference on Principles and Practices ... - MADOC

You also want an ePaper? Increase the reach of your titles
YUMPU automatically turns print PDFs into web optimized ePapers that Google loves.
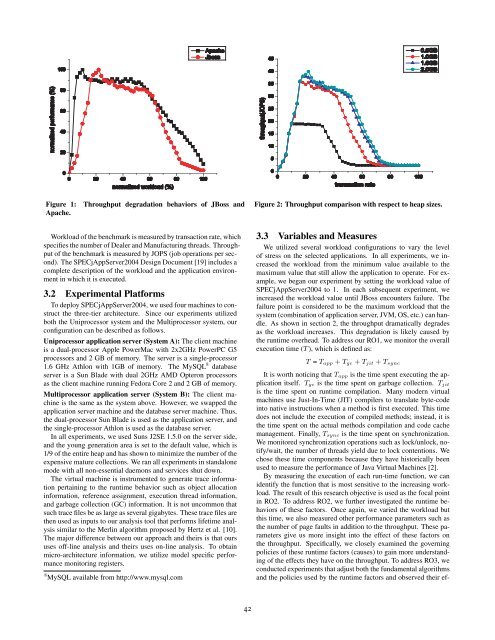
Figure 1:<br />
Apache.<br />
Throughput degradati<strong>on</strong> behaviors of JBoss <strong>and</strong><br />
Figure 2: Throughput comparis<strong>on</strong> with respect to heap sizes.<br />
Workload of the benchmark is measured by transacti<strong>on</strong> rate, which<br />
specifies the number of Dealer <strong>and</strong> Manufacturing threads. Throughput<br />
of the benchmark is measured by JOPS (job operati<strong>on</strong>s per sec<strong>on</strong>d).<br />
The SPECjAppServer2004 Design Document [19] includes a<br />
complete descripti<strong>on</strong> of the workload <strong>and</strong> the applicati<strong>on</strong> envir<strong>on</strong>ment<br />
in which it is executed.<br />
3.2 Experimental Platforms<br />
To deploy SPECjAppServer2004, we used four machines to c<strong>on</strong>struct<br />
the three-tier architecture. Since our experiments utilized<br />
both the Uniprocessor system <strong>and</strong> the Multiprocessor system, our<br />
c<strong>on</strong>figurati<strong>on</strong> can be described as follows.<br />
Uniprocessor applicati<strong>on</strong> server (System A): The client machine<br />
is a dual-processor Apple PowerMac with 2x2GHz PowerPC G5<br />
processors <strong>and</strong> 2 GB of memory. The server is a single-processor<br />
1.6 GHz Athl<strong>on</strong> with 1GB of memory. The MySQL 8 database<br />
server is a Sun Blade with dual 2GHz AMD Opter<strong>on</strong> processors<br />
as the client machine running Fedora Core 2 <strong>and</strong> 2 GB of memory.<br />
Multiprocessor applicati<strong>on</strong> server (System B): The client machine<br />
is the same as the system above. However, we swapped the<br />
applicati<strong>on</strong> server machine <strong>and</strong> the database server machine. Thus,<br />
the dual-processor Sun Blade is used as the applicati<strong>on</strong> server, <strong>and</strong><br />
the single-processor Athl<strong>on</strong> is used as the database server.<br />
In all experiments, we used Suns J2SE 1.5.0 <strong>on</strong> the server side,<br />
<strong>and</strong> the young generati<strong>on</strong> area is set to the default value, which is<br />
1/9 of the entire heap <strong>and</strong> has shown to minimize the number of the<br />
expensive mature collecti<strong>on</strong>s. We ran all experiments in st<strong>and</strong>al<strong>on</strong>e<br />
mode with all n<strong>on</strong>-essential daem<strong>on</strong>s <strong>and</strong> services shut down.<br />
The virtual machine is instrumented to generate trace informati<strong>on</strong><br />
pertaining to the runtime behavior such as object allocati<strong>on</strong><br />
informati<strong>on</strong>, reference assignment, executi<strong>on</strong> thread informati<strong>on</strong>,<br />
<strong>and</strong> garbage collecti<strong>on</strong> (GC) informati<strong>on</strong>. It is not uncomm<strong>on</strong> that<br />
such trace files be as large as several gigabytes. These trace files are<br />
then used as inputs to our analysis tool that performs lifetime analysis<br />
similar to the Merlin algorithm proposed by Hertz et al. [10].<br />
The major difference between our approach <strong>and</strong> theirs is that ours<br />
uses off-line analysis <strong>and</strong> theirs uses <strong>on</strong>-line analysis. To obtain<br />
micro-architecture informati<strong>on</strong>, we utilize model specific performance<br />
m<strong>on</strong>itoring registers.<br />
8 MySQL available from http://www.mysql.com<br />
3.3 Variables <strong>and</strong> Measures<br />
We utilized several workload c<strong>on</strong>figurati<strong>on</strong>s to vary the level<br />
of stress <strong>on</strong> the selected applicati<strong>on</strong>s. In all experiments, we increased<br />
the workload from the minimum value available to the<br />
maximum value that still allow the applicati<strong>on</strong> to operate. For example,<br />
we began our experiment by setting the workload value of<br />
SPECjAppServer2004 to 1. In each subsequent experiment, we<br />
increased the workload value until JBoss encounters failure. The<br />
failure point is c<strong>on</strong>sidered to be the maximum workload that the<br />
system (combinati<strong>on</strong> of applicati<strong>on</strong> server, JVM, OS, etc.) can h<strong>and</strong>le.<br />
As shown in secti<strong>on</strong> 2, the throughput dramatically degrades<br />
as the workload increases. This degradati<strong>on</strong> is likely caused by<br />
the runtime overhead. To address our RO1, we m<strong>on</strong>itor the overall<br />
executi<strong>on</strong> time (T ), which is defined as:<br />
T = T app + T gc + T jit + T sync<br />
It is worth noticing that T app is the time spent executing the applicati<strong>on</strong><br />
itself. T gc is the time spent <strong>on</strong> garbage collecti<strong>on</strong>. T jit<br />
is the time spent <strong>on</strong> runtime compilati<strong>on</strong>. Many modern virtual<br />
machines use Just-In-Time (JIT) compilers to translate byte-code<br />
into native instructi<strong>on</strong>s when a method is first executed. This time<br />
does not include the executi<strong>on</strong> of compiled methods; instead, it is<br />
the time spent <strong>on</strong> the actual methods compilati<strong>on</strong> <strong>and</strong> code cache<br />
management. Finally, T sync is the time spent <strong>on</strong> synchr<strong>on</strong>izati<strong>on</strong>.<br />
We m<strong>on</strong>itored synchr<strong>on</strong>izati<strong>on</strong> operati<strong>on</strong>s such as lock/unlock, notify/wait,<br />
the number of threads yield due to lock c<strong>on</strong>tenti<strong>on</strong>s. We<br />
chose these time comp<strong>on</strong>ents because they have historically been<br />
used to measure the performance of Java Virtual Machines [2].<br />
By measuring the executi<strong>on</strong> of each run-time functi<strong>on</strong>, we can<br />
identify the functi<strong>on</strong> that is most sensitive to the increasing workload.<br />
The result of this research objective is used as the focal point<br />
in RO2. To address RO2, we further investigated the runtime behaviors<br />
of these factors. Once again, we varied the workload but<br />
this time, we also measured other performance parameters such as<br />
the number of page faults in additi<strong>on</strong> to the throughput. These parameters<br />
give us more insight into the effect of these factors <strong>on</strong><br />
the throughput. Specifically, we closely examined the governing<br />
policies of these runtime factors (causes) to gain more underst<strong>and</strong>ing<br />
of the effects they have <strong>on</strong> the throughput. To address RO3, we<br />
c<strong>on</strong>ducted experiments that adjust both the fundamental algorithms<br />
<strong>and</strong> the policies used by the runtime factors <strong>and</strong> observed their ef-<br />
42