4th International Conference on Principles and Practices ... - MADOC
4th International Conference on Principles and Practices ... - MADOC
4th International Conference on Principles and Practices ... - MADOC

Create successful ePaper yourself
Turn your PDF publications into a flip-book with our unique Google optimized e-Paper software.
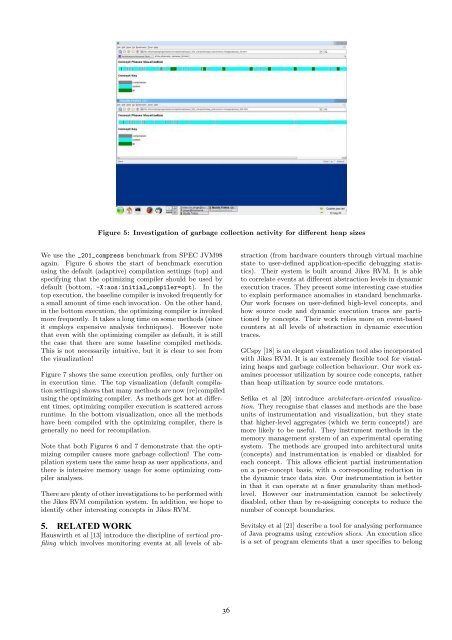
Figure 5: Investigati<strong>on</strong> of garbage collecti<strong>on</strong> activity for different heap sizes<br />
We use the _201_compress benchmark from SPEC JVM98<br />
again. Figure 6 shows the start of benchmark executi<strong>on</strong><br />
using the default (adaptive) compilati<strong>on</strong> settings (top) <strong>and</strong><br />
specifying that the optimizing compiler should be used by<br />
default (bottom, -X:aos:initial compiler=opt). In the<br />
top executi<strong>on</strong>, the baseline compiler is invoked frequently for<br />
a small amount of time each invocati<strong>on</strong>. On the other h<strong>and</strong>,<br />
in the bottom executi<strong>on</strong>, the optimizing compiler is invoked<br />
more frequently. It takes a l<strong>on</strong>g time <strong>on</strong> some methods (since<br />
it employs expensive analysis techniques). However note<br />
that even with the optimizing compiler as default, it is still<br />
the case that there are some baseline compiled methods.<br />
This is not necessarily intuitive, but it is clear to see from<br />
the visualizati<strong>on</strong>!<br />
Figure 7 shows the same executi<strong>on</strong> profiles, <strong>on</strong>ly further <strong>on</strong><br />
in executi<strong>on</strong> time. The top visualizati<strong>on</strong> (default compilati<strong>on</strong><br />
settings) shows that many methods are now (re)compiled<br />
using the optimizing compiler. As methods get hot at different<br />
times, optimizing compiler executi<strong>on</strong> is scattered across<br />
runtime. In the bottom visualizati<strong>on</strong>, <strong>on</strong>ce all the methods<br />
have been compiled with the optimizing compiler, there is<br />
generally no need for recompilati<strong>on</strong>.<br />
Note that both Figures 6 <strong>and</strong> 7 dem<strong>on</strong>strate that the optimizing<br />
compiler causes more garbage collecti<strong>on</strong>! The compilati<strong>on</strong><br />
system uses the same heap as user applicati<strong>on</strong>s, <strong>and</strong><br />
there is intensive memory usage for some optimizing compiler<br />
analyses.<br />
There are plenty of other investigati<strong>on</strong>s to be performed with<br />
the Jikes RVM compilati<strong>on</strong> system. In additi<strong>on</strong>, we hope to<br />
identify other interesting c<strong>on</strong>cepts in Jikes RVM.<br />
5. RELATED WORK<br />
Hauswirth et al [13] introduce the discipline of vertical profiling<br />
which involves m<strong>on</strong>itoring events at all levels of abstracti<strong>on</strong><br />
(from hardware counters through virtual machine<br />
state to user-defined applicati<strong>on</strong>-specific debugging statistics).<br />
Their system is built around Jikes RVM. It is able<br />
to correlate events at different abstracti<strong>on</strong> levels in dynamic<br />
executi<strong>on</strong> traces. They present some interesting case studies<br />
to explain performance anomalies in st<strong>and</strong>ard benchmarks.<br />
Our work focuses <strong>on</strong> user-defined high-level c<strong>on</strong>cepts, <strong>and</strong><br />
how source code <strong>and</strong> dynamic executi<strong>on</strong> traces are partiti<strong>on</strong>ed<br />
by c<strong>on</strong>cepts. Their work relies more <strong>on</strong> event-based<br />
counters at all levels of abstracti<strong>on</strong> in dynamic executi<strong>on</strong><br />
traces.<br />
GCspy [18] is an elegant visualizati<strong>on</strong> tool also incorporated<br />
with Jikes RVM. It is an extremely flexible tool for visualizing<br />
heaps <strong>and</strong> garbage collecti<strong>on</strong> behaviour. Our work examines<br />
processor utilizati<strong>on</strong> by source code c<strong>on</strong>cepts, rather<br />
than heap utilizati<strong>on</strong> by source code mutators.<br />
Sefika et al [20] introduce architecture-oriented visualizati<strong>on</strong>.<br />
They recognise that classes <strong>and</strong> methods are the base<br />
units of instrumentati<strong>on</strong> <strong>and</strong> visualizati<strong>on</strong>, but they state<br />
that higher-level aggregates (which we term c<strong>on</strong>cepts!) are<br />
more likely to be useful. They instrument methods in the<br />
memory management system of an experimental operating<br />
system. The methods are grouped into architectural units<br />
(c<strong>on</strong>cepts) <strong>and</strong> instrumentati<strong>on</strong> is enabled or disabled for<br />
each c<strong>on</strong>cept. This allows efficient partial instrumentati<strong>on</strong><br />
<strong>on</strong> a per-c<strong>on</strong>cept basis, with a corresp<strong>on</strong>ding reducti<strong>on</strong> in<br />
the dynamic trace data size. Our instrumentati<strong>on</strong> is better<br />
in that it can operate at a finer granularity than methodlevel.<br />
However our instrumentati<strong>on</strong> cannot be selectively<br />
disabled, other than by re-assigning c<strong>on</strong>cepts to reduce the<br />
number of c<strong>on</strong>cept boundaries.<br />
Sevitsky et al [21] describe a tool for analysing performance<br />
of Java programs using executi<strong>on</strong> slices. An executi<strong>on</strong> slice<br />
is a set of program elements that a user specifies to bel<strong>on</strong>g<br />
36