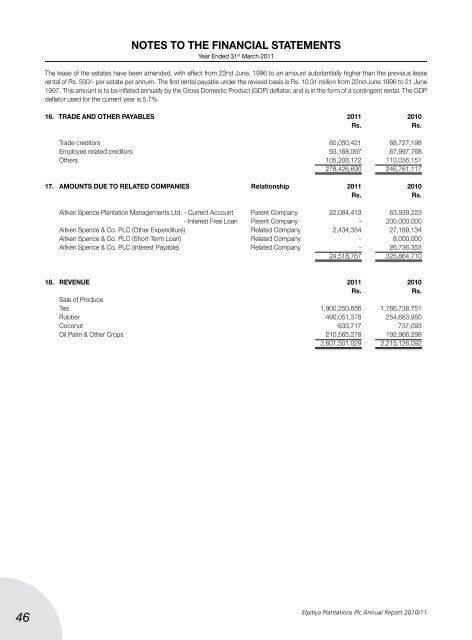
Notes to the Financial Statements Year Ended 31 st March 20<strong>11</strong> The lease of the estates have been amended, with effect from 22nd June, 1996 to an amount substantially higher than the previous lease rental of Rs. 500/- per estate per annum. The first rental payable under the revised basis is Rs. 10.31 million from 22nd June 1996 to 21 June 1997. This amount is to be inflated annually by the Gross Domestic Product (GDP) deflator, and is in the form of a contingent rental. The GDP deflator used for the current year is 5.7%. 16. TRADE AND OTHER PAYABLES 20<strong>11</strong> <strong>2010</strong> Rs. Rs. Trade creditors 80,050,421 68,727,198 Employee related creditors 93,168,097 67,997,768 Others 105,208,172 <strong>11</strong>0,036,151 278,426,690 246,761,<strong>11</strong>7 17. AMOUNTS DUE TO RELATED COMPANIES Relationship 20<strong>11</strong> <strong>2010</strong> Rs. Rs. Aitken Spence Plantation Managements Ltd. - Current Account Parent Company 22,084,413 63,939,223 - Interest Free Loan Parent Company - 200,000,000 Aitken Spence & Co. PLC (Other Expenditure) Related Company 2,434,354 27,189,134 Aitken Spence & Co. PLC (Short Term Loan) Related Company - 8,000,000 Aitken Spence & Co. PLC (Interest Payable) Related Company - 26,736,353 24,518,767 325,864,710 18. REVENUE 20<strong>11</strong> <strong>2010</strong> Rs. Rs. Sale of Produce Tea 1,900,250,656 1,766,738,751 Rubber 490,051,378 254,683,950 Coconut 633,717 737,093 Oil Palm & Other Crops 210,565,278 192,966,298 2,601,501,029 2,215,126,092 46 <strong>Elpitiya</strong> <strong>Plantations</strong> <strong>Plc</strong> <strong>Annual</strong> <strong>Report</strong> <strong>2010</strong>/<strong>11</strong>
Notes to the Financial Statements Year Ended 31 st March 20<strong>11</strong> 18a Segment Information Industry Tea Rubber Coconut Oil Palm & Other crop Total 20<strong>11</strong> <strong>2010</strong> 20<strong>11</strong> <strong>2010</strong> 20<strong>11</strong> <strong>2010</strong> 20<strong>11</strong> <strong>2010</strong> 20<strong>11</strong> <strong>2010</strong> Rs. Rs. Rs. Rs. Rs. Rs. Rs. Rs. Rs. Rs. Revenue 1,900,250,656 1,766,738,751 490,051,378 254,683,950 633,717 737,093 210,565,278 192,966,298 2,601,501,029 2,215,126,092 Revenue Expenditure (1,577,239,232) (1,529,612,239) (181,565,532) (134,967,976) 827,968 1,013,389 (66,814,856) (49,437,107) (1,824,791,652) (1,713,003,933) Depreciation / Amortization (60,816,994) (52,027,061) (23,802,595) (20,029,686) (772,740) (650,685) (18,416,690) (15,507,754) (103,809,019) (88,215,186) Gratuity (45,971,151) (101,851,381) (17,992,219) (39,2<strong>11</strong>,348) (584,109) (1,273,820) (13,921,050) (30,358,935) (78,468,529) (172,695,484) Segment Results 216,223,279 83,248,070 266,691,032 60,474,940 104,836 (174,023) <strong>11</strong>1,412,683 97,662,502 594,431,830 241,2<strong>11</strong>,489 Other Income 99,055,529 81,097,740 Unallocated Expenses (159,319,697) (143,037,064) Management Fees & workers profit share (40,059,177) (10,202,236) Finance cost (144,583,738) (144,075,445) Income tax Expence (20,728,587) - Share of Profit/ (Loss) of Joint Ventures 34,707,997 38,822,310 Profit/ (Loss) for the year 363,504,155 63,816,794 18b Segment Assets non Current Assets Cost 2,253,030,799 2,058,758,510 881,792,659 792,366,805 28,626,975 613,042,418 682,266,047 102,998,862 3,845,716,480 3,567,166,595 Accumulated Depreciation / Amortization (528,432,109) (467,<strong>11</strong>3,031) (206,818,102) (179,831,941) (6,714,250) (139,232,812) (160,020,576) (5,842,023) (901,985,037) (792,019,807) 1,724,598,690 1,591,645,480 674,974,557 612,534,864 21,912,725 473,809,606 522,245,471 97,156,839 2,943,731,443 2,775,146,788 Current Assets 260,913,849 <strong>11</strong>2,078,753 58,699,075 43,148,742 276,107 33,407,417 6,580,458 1,401,731 326,469,490 190,036,643 1,985,512,539 1,703,724,232 733,673,632 655,683,606 22,188,832 507,217,023 528,825,929 98,558,570 3,270,200,933 2,965,183,431 Unallocated Non Current Assets Cost 160,522,593 157,565,761 Accumulated Depreciation / Amortization (17,955,154) (22,096,309) 142,567,439 135,469,452 Current Assets 254,015,924 584,065,510 396,583,363 719,534,962 Total Non Current Assets 3,086,298,882 2,910,616,240 Total Current Assets 580,485,414 774,102,153 Total Assets 3,666,784,296 3,684,718,393 18c Segment Liabilities non Current Liabilities 271,927,160 264,460,824 106,427,029 101,813,694 3,455,102 3,307,521 82,345,376 78,828,082 464,154,667 448,410,121 271,927,160 264,460,824 106,427,029 101,813,694 3,455,102 3,307,521 82,345,376 78,828,082 464,154,667 448,410,121 Current Liabilities 359,680,232 523,730,799 140,771,883 201,628,985 4,570,091 6,550,122 108,918,889 156,108,924 613,941,095 888,018,830 Unallocated Non Current Liabilities 1,225,404,100 1,330,292,550 Total Non Current Liabilities 1,689,558,767 1,778,702,671 Capital and Reserve 1,363,284,434 1,017,996,892 Total Equity and Liabilities 3,666,784,296 3,684,718,393 18d Segment Capital Expenditure Cost 20,339,876 27,573,393 84,106,8<strong>11</strong> 97,686,646 - - <strong>11</strong>4,544,954 136,884,104 218,991,641 262,144,143 <strong>Elpitiya</strong> <strong>Plantations</strong> <strong>Plc</strong> <strong>Annual</strong> <strong>Report</strong> <strong>2010</strong>/<strong>11</strong> 47