WMJ 05 2011 - World Medical Association
WMJ 05 2011 - World Medical Association
WMJ 05 2011 - World Medical Association

You also want an ePaper? Increase the reach of your titles
YUMPU automatically turns print PDFs into web optimized ePapers that Google loves.
Public Health<br />
SOUTH AFRICA<br />
% of insured<br />
17%<br />
17%<br />
16%<br />
16%<br />
15%<br />
15%<br />
14%<br />
14%<br />
13%<br />
14% 14%<br />
14%<br />
15%<br />
16%<br />
16%<br />
6.7 6.7 6.8 7.1 7.5 7.9 8.1<br />
39.7 39.9 40.1 40.3 40.4 40.8 41.2<br />
2003 2004 20<strong>05</strong> 2006 2007 2008 2009<br />
Insured Uninsured % of insured<br />
45<br />
40<br />
16%<br />
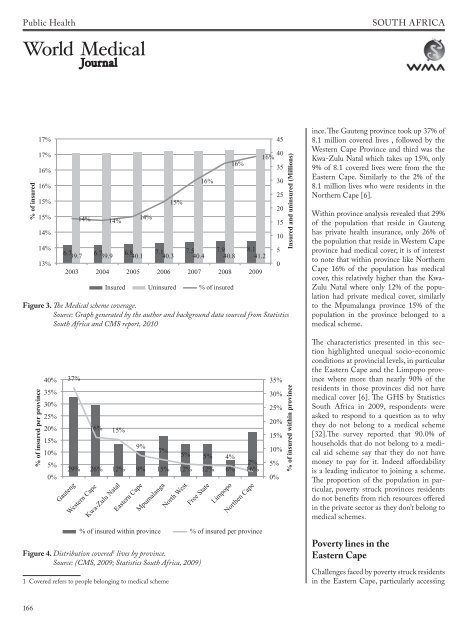
Figure 3. The <strong>Medical</strong> scheme coverage.<br />
Source: Graph generated by the author and background data sourced from Statistics<br />
South Africa and CMS report, 2010<br />
35<br />
30<br />
25<br />
20<br />
15<br />
10<br />
5<br />
0<br />
Insured and uninsured (Millions)<br />
ince. The Gauteng province took up 37% of<br />
8.1 million covered lives , followed by the<br />
Western Cape Province and third was the<br />
Kwa-Zulu Natal which takes up 15%, only<br />
9% of 8.1 covered lives were from the the<br />
Eastern Cape. Similarly to the 2% of the<br />
8.1 million lives who were residents in the<br />
Northern Cape [6].<br />
Within province analysis revealed that 29%<br />
of the population that reside in Gauteng<br />
has private health insurance, only 26% of<br />
the population that reside in Western Cape<br />
province had medical cover, it is of interest<br />
to note that within province like Northern<br />
Cape 16% of the population has medical<br />
cover, this relatively higher than the Kwa-<br />
Zulu Natal where only 12% of the population<br />
had private medical cover, similarly<br />
to the Mpumalanga province 15% of the<br />
population in the province belonged to a<br />
medical scheme.<br />
% of insured per province<br />
40%<br />
35%<br />
30%<br />
25%<br />
20%<br />
15%<br />
10%<br />
5%<br />
0%<br />
37%<br />
16% 15%<br />
9%<br />
7%<br />
5% 5% 4%<br />
2%<br />
29% 26% 12% 9% 15% 12% 12% 6% 16%<br />
Gauteng<br />
Western Cape<br />
Kwa-Zulu Natal<br />
Eastern Cape<br />
Mpumalanga<br />
North West<br />
Free State<br />
Limpopo<br />
Northen Cape<br />
% of insured within province % of insured per province<br />
Figure 4. Distribution covered 1 lives by province.<br />
Source: (CMS, 2009; Statistics South Africa, 2009)<br />
1 Covered refers to people belonging to medical scheme<br />
35%<br />
30%<br />
25%<br />
20%<br />
15%<br />
10%<br />
5%<br />
0%<br />
% of insured within province<br />
The characteristics presented in this section<br />
highlighted unequal socio-economic<br />
conditions at provincial levels, in particular<br />
the Eastern Cape and the Limpopo province<br />
where more than nearly 90% of the<br />
residents in those provinces did not have<br />
medical cover [6]. The GHS by Statistics<br />
South Africa in 2009, respondents were<br />
asked to respond to a question as to why<br />
they do not belong to a medical scheme<br />
[32].The survey reported that 90.0% of<br />
households that do not belong to a medical<br />
aid scheme say that they do not have<br />
money to pay for it. Indeed affordability<br />
is a leading indicator to joining a scheme.<br />
The proportion of the population in particular,<br />
poverty struck provinces residents<br />
do not benefits from rich resources offered<br />
in the private sector as they don’t belong to<br />
medical schemes.<br />
Poverty lines in the<br />
Eastern Cape<br />
Challenges faced by poverty struck residents<br />
in the Eastern Cape, particularly accessing<br />
166