University of Groningen Groningen Growth and Development Centre ...
University of Groningen Groningen Growth and Development Centre ...
University of Groningen Groningen Growth and Development Centre ...

Create successful ePaper yourself
Turn your PDF publications into a flip-book with our unique Google optimized e-Paper software.
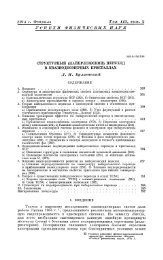
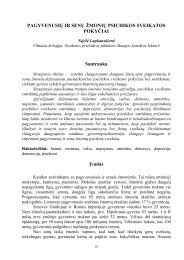
Table 4<br />
Unit Value Ratios <strong>and</strong> Reliability Indicators by Manufacturing Branch,<br />
Mexico/USA, 1988<br />
US Number Unit value Ratios (pesos/US$) Price Coefficient <strong>of</strong> variation Matched Output as<br />
SIC <strong>of</strong> Mexican US Geo- Level Mexican US Percentage <strong>of</strong> Total<br />
1987 product Quantity quantity metric (USA Quantity quantity USA Mexico<br />
matches Weights weights average =100 Weights weights<br />
20 Food Products 73 1 841 1 186 1 477 65 0.032 0.035 65.8 59.9<br />
21 Tobacco Products 2 1 218 1 229 1 224 53 n.a. n.a 97.1 98.0<br />
22 Textiles 30 2 141 1 468 1 773 77 n.a. 0.056 100.0 56.8<br />
23 Clothing <strong>and</strong> Apparel 32 1 490 1 043 1 247 54 0.046 0.029 41.3 40.5<br />
24 Wood Products. Except Furniture 12 1 960 1 414 1 665 73 0.038 0.021 28.1 40.4<br />
25 Furniture <strong>and</strong> Fixtures 12 2 244 2 231 2 237 98 0.060 0.024 35.5 57.9<br />
26 Paper <strong>and</strong> Allied Products 13 2 262 2 023 2 139 93 0.045 0.036 63.2 72.7<br />
27 Printing <strong>and</strong> Publishing 7 1 317 1 258 1 287 56 0.032 0.037 6.4 13.3<br />
28 Chemicals 41 2 303 1 662 1 956 85 0.035 0.059 23.3 28.2<br />
30 Rubber <strong>and</strong> Plastics 11 1 067 1 175 1 120 49 0.100 0.103 4.5 21.2<br />
31 Leather <strong>and</strong> Leather Products 10 1 468 1 511 1 489 65 n.a. 0.038 100.0 61.0<br />
32 Non-metallic minerals 23 2 392 1 590 1 950 85 0.071 0.034 25.9 49.6<br />
33 Primary Metals 26 2 425 2 552 2 488 109 0.030 0.027 67.2 43.7<br />
34 Metal Products 28 1 807 1 077 1 395 61 0.054 0.048 8.7 49.9<br />
35 Machinery <strong>and</strong> Computers 34 2 052 1 937 1 994 87 0.049 0.050 9.3 35.1<br />
36 Electronic & Electrical Equipment 41 2 373 1 877 2 111 92 0.053 0.065 14.6 22.4<br />
37 Transportation Equipment 21 2 119 1 815 1 961 86 0.029 0.050 34.6 49.8<br />
38 Pr<strong>of</strong>essional Equipment 8 2 962 3 141 3 050 133 0.031 0.015 22.8 50.5<br />
39 Other Industries 11 1 417 1 813 1 603 70 0.210 0.101 8.5 16.4<br />
20-39 Total Manufacturing 435 2 033 1 511 1 753 77 0.012 0.015 33.3 46.1<br />
Exchange Rate 2 290 2 290 2 290<br />
Note: the UVRs for the branch printing <strong>and</strong> publishing are not the same as those in Table 2. In Table 2, US<br />
production is in 1987 prices <strong>and</strong> volumes <strong>and</strong> Mexican production in 1988 prices <strong>and</strong> volumes. In Table 4, US<br />
quantities <strong>and</strong> prices were adjusted to 1988. Sources <strong>of</strong> Tables 3 <strong>and</strong> 4: censuses <strong>of</strong> manufacturing as described in<br />
the Text.<br />
5. Reconciliation <strong>of</strong> Industrial Census Data with the National Accounts<br />
Before calculating relative productivity levels, it is important to assess the consistency <strong>of</strong> the<br />
information in the censuses with estimates <strong>of</strong> output <strong>and</strong> employment in the national accounts (see<br />
Table 5). A major difficulty in reconciling census information with the national accounts is that the<br />
value added concepts in the censuses strongly differ from those in the national accounts: in general the<br />
former only deduct intermediate goods <strong>and</strong> industrial services from gross output, while the latter also<br />
exclude non-industrial services. Moreover, although the concept <strong>of</strong> value added in national accounts<br />
is similar in the three countries due to the international guidelines <strong>of</strong> UN/IMF/OECD/Eurostat, the<br />
censuses in Brazil, Mexico <strong>and</strong> the USA each adopted a different value added concept. Van Ark <strong>and</strong><br />
Maddison (1994) <strong>and</strong> detailed definitions <strong>and</strong> data in the production censuses made it possible to<br />
harmonise the value added data between the censuses <strong>and</strong> the national accounts for Brazil <strong>and</strong> Mexico.<br />
For the USA, the census lacks detailed data on inputs <strong>and</strong> therefore it was not possible to harmonise<br />
the value added data between the census <strong>and</strong> national accounts.<br />
In Brazil, the census value added concept (valor de transformação industrial) is larger than the<br />
national accounts concept as it includes various non-industrial services. In the census, detailed data<br />
are available on these non-industrial services only for the 21 major industry groups. So branch ratios<br />
had to be used to derive a rough estimate <strong>of</strong> these inputs for each industry. After the deduction <strong>of</strong><br />
14