University of Groningen Groningen Growth and Development Centre ...
University of Groningen Groningen Growth and Development Centre ...
University of Groningen Groningen Growth and Development Centre ...

You also want an ePaper? Increase the reach of your titles
YUMPU automatically turns print PDFs into web optimized ePapers that Google loves.
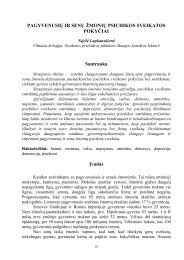
As Mexico, Brazil tried to maintain a constant exchange rate in the 1970s (it only adopted<br />
mini-devaluations), which together with a relatively high rate <strong>of</strong> inflation led to an increase <strong>of</strong> the<br />
price level. A major devaluation (by 30 per cent) did not occur until the end <strong>of</strong> 1979 explaining the<br />
fall in the relative price level. The contagion <strong>of</strong> the debt crisis in 1982 led to a major depreciation <strong>and</strong><br />
fall in price level. From 1985 onwards, the government maintained the nominal exchange rate while<br />
inflation accelerated, causing a steep rise in the price level. This policy changed in 1989, with a range<br />
<strong>of</strong> stop-<strong>and</strong>-go policies, fixing the exchange rate for some months <strong>and</strong> introducing subsequently major<br />
devaluations. This led to a sharp drop in the price level between 1989 <strong>and</strong> 1991. In the subsequent<br />
years, the exchange rate was stabilised using massive market interventions, until the introduction <strong>of</strong><br />
the Real in July 1994.<br />
Figure 3 also shows the price level <strong>of</strong> the total economy. In Mexico, the overall price level<br />
was below that <strong>of</strong> manufacturing during the entire period, as expected by the Balassa Hypothesis. The<br />
trends for manufacturing <strong>and</strong> the total economy were almost the same. The few years for which PPPs<br />
are available for Brazil show the contrary. This is explained by the introduction <strong>of</strong> the Real in 1993-<br />
94, which led to a strong increase in the relative price level. Internationally exposed sectors, such as<br />
manufacturing, limited much more than the other sectors the price increases to reduce the loss <strong>of</strong><br />
market shares on their home <strong>and</strong> foreign markets.<br />
Figure 3<br />
Trends in Brazilian <strong>and</strong> Relative Mexican Price Levels in Manufacturing <strong>and</strong><br />
the Total economy, USA =1,00<br />
Brazil<br />
Mexico<br />
1,10<br />
1,1<br />
1,00<br />
0,90<br />
1<br />
0,9<br />
Ratio <strong>of</strong> RVU to<br />
exchange rate<br />
0,80<br />
0,70<br />
0,60<br />
0,50<br />
Ratio <strong>of</strong> RVU to<br />
exchange rate<br />
Ratio <strong>of</strong> PPP to<br />
exchange rate<br />
0,8<br />
0,7<br />
0,6<br />
0,5<br />
Ratio <strong>of</strong> PPP to<br />
exchange rate<br />
0,40<br />
0,4<br />
0,30<br />
1970 1975 1980 1985 1990 1995<br />
0,3<br />
1970 1975 1980 1985 1990 1995<br />
Sources: benchmark UVRs from Tables 3 <strong>and</strong> 4, extrapolated with time series <strong>of</strong> manufacturing deflators derived<br />
by dividing current value added by constant value added from the national accounts as described in Figure 1. PPPs<br />
are from World Bank, World <strong>Development</strong> Indicators 2001. The price levels <strong>of</strong> the total economy is measured by<br />
the ratio <strong>of</strong> the PPP to exchange rate; that <strong>of</strong> manufacturing is measured by the ratio <strong>of</strong> the RVU to exchange rate.<br />
Series <strong>of</strong> nominal exchange rates from CEPII, the CHELEM database.<br />
Productivity Levels<br />
The benchmark estimates for 1985 <strong>and</strong> 1988 can be extrapolated with time series for value added at<br />
constant prices <strong>and</strong> employment for the 1970-99 period, see Figure 3. As shown in Figure 2,<br />
productivity growth has been faster in the USA than in Brazil <strong>and</strong> Mexico. As a consequence, the<br />
productivity gaps between Brazil <strong>and</strong> Mexico on the one h<strong>and</strong> <strong>and</strong> the USA on the other widened over<br />
time. The largest drop in overall relative productivity <strong>of</strong> the Latin countries occurred in particular<br />
18