University of Groningen Groningen Growth and Development Centre ...
University of Groningen Groningen Growth and Development Centre ...
University of Groningen Groningen Growth and Development Centre ...

Create successful ePaper yourself
Turn your PDF publications into a flip-book with our unique Google optimized e-Paper software.
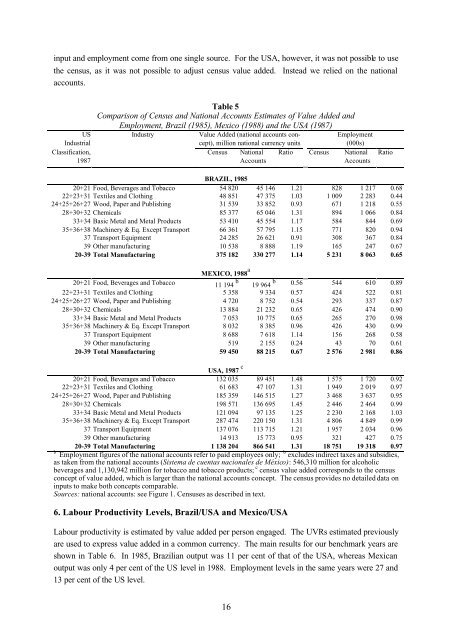
input <strong>and</strong> employment come from one single source. For the USA, however, it was not possible to use<br />
the census, as it was not possible to adjust census value added. Instead we relied on the national<br />
accounts.<br />
Table 5<br />
Comparison <strong>of</strong> Census <strong>and</strong> National Accounts Estimates <strong>of</strong> Value Added <strong>and</strong><br />
Employment, Brazil (1985), Mexico (1988) <strong>and</strong> the USA (1987)<br />
US Industry Value Added (national accounts con- Employment<br />
Industrial cept), million national currency units (000s)<br />
Classification, Census National Ratio Census National Ratio<br />
1987 Accounts Accounts<br />
BRAZIL, 1985<br />
20+21 Food, Beverages <strong>and</strong> Tobacco 54 820 45 146 1.21 828 1 217 0.68<br />
22+23+31 Textiles <strong>and</strong> Clothing 48 851 47 375 1.03 1 009 2 283 0.44<br />
24+25+26+27 Wood, Paper <strong>and</strong> Publishing 31 539 33 852 0.93 671 1 218 0.55<br />
28+30+32 Chemicals 85 377 65 046 1.31 894 1 066 0.84<br />
33+34 Basic Metal <strong>and</strong> Metal Products 53 410 45 554 1.17 584 844 0.69<br />
35+36+38 Machinery & Eq. Except Transport 66 361 57 795 1.15 771 820 0.94<br />
37 Transport Equipment 24 285 26 621 0.91 308 367 0.84<br />
39 Other manufacturing 10 538 8 888 1.19 165 247 0.67<br />
20-39 Total Manufacturing 375 182 330 277 1.14 5 231 8 063 0.65<br />
MEXICO, 1988 a<br />
20+21 Food, Beverages <strong>and</strong> Tobacco 11 194 b 19 964 b 0.56 544 610 0.89<br />
22+23+31 Textiles <strong>and</strong> Clothing 5 358 9 334 0.57 424 522 0.81<br />
24+25+26+27 Wood, Paper <strong>and</strong> Publishing 4 720 8 752 0.54 293 337 0.87<br />
28+30+32 Chemicals 13 884 21 232 0.65 426 474 0.90<br />
33+34 Basic Metal <strong>and</strong> Metal Products 7 053 10 775 0.65 265 270 0.98<br />
35+36+38 Machinery & Eq. Except Transport 8 032 8 385 0.96 426 430 0.99<br />
37 Transport Equipment 8 688 7 618 1.14 156 268 0.58<br />
39 Other manufacturing 519 2 155 0.24 43 70 0.61<br />
20-39 Total Manufacturing 59 450 88 215 0.67 2 576 2 981 0.86<br />
USA, 1987 c<br />
20+21 Food, Beverages <strong>and</strong> Tobacco 132 035 89 451 1.48 1 575 1 720 0.92<br />
22+23+31 Textiles <strong>and</strong> Clothing 61 683 47 107 1.31 1 949 2 019 0.97<br />
24+25+26+27 Wood, Paper <strong>and</strong> Publishing 185 359 146 515 1.27 3 468 3 637 0.95<br />
28+30+32 Chemicals 198 571 136 695 1.45 2 446 2 464 0.99<br />
33+34 Basic Metal <strong>and</strong> Metal Products 121 094 97 135 1.25 2 230 2 168 1.03<br />
35+36+38 Machinery & Eq. Except Transport 287 474 220 150 1.31 4 806 4 849 0.99<br />
37 Transport Equipment 137 076 113 715 1.21 1 957 2 034 0.96<br />
39 Other manufacturing 14 913 15 773 0.95 321 427 0.75<br />
20-39 Total Manufacturing 1 138 204 866 541 1.31 18 751 19 318 0.97<br />
b<br />
Employment figures <strong>of</strong> the national accounts refer to paid employees only; b excludes indirect taxes <strong>and</strong> subsidies,<br />
as taken from the national accounts (Sistema de cuentas nacionales de México): 546,310 million for alcoholic<br />
beverages <strong>and</strong> 1,130,942 million for tobacco <strong>and</strong> tobacco products; c census value added corresponds to the census<br />
concept <strong>of</strong> value added, which is larger than the national accounts concept. The census provides no detailed data on<br />
inputs to make both concepts comparable.<br />
Sources: national accounts: see Figure 1. Censuses as described in text.<br />
6. Labour Productivity Levels, Brazil/USA <strong>and</strong> Mexico/USA<br />
Labour productivity is estimated by value added per person engaged. The UVRs estimated previously<br />
are used to express value added in a common currency. The main results for our benchmark years are<br />
shown in Table 6. In 1985, Brazilian output was 11 per cent <strong>of</strong> that <strong>of</strong> the USA, whereas Mexican<br />
output was only 4 per cent <strong>of</strong> the US level in 1988. Employment levels in the same years were 27 <strong>and</strong><br />
13 per cent <strong>of</strong> the US level.<br />
16