University of Groningen Groningen Growth and Development Centre ...
University of Groningen Groningen Growth and Development Centre ...
University of Groningen Groningen Growth and Development Centre ...

You also want an ePaper? Increase the reach of your titles
YUMPU automatically turns print PDFs into web optimized ePapers that Google loves.
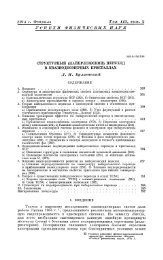
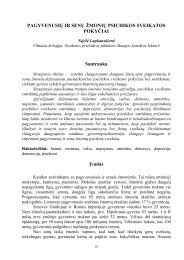
Table 8<br />
Relative levels <strong>of</strong> unit labour costs<br />
Brazil/United States (1985) et Mexico/USA (1988)<br />
SIC Brazil/USA. 1985 Mexico/USA. 1988<br />
Units labour Compensation Labour Units labour Compensation Labour<br />
costs per employee Productivity costs per employee Productivity<br />
(USA=100)<br />
(USA=100)<br />
20 Food products 16.8 7.8 46.5 35.4 9.4 26.5<br />
21 Tobacco Products 41.8 8.6 20.5 35.0 9.3 26.7<br />
22 Textile Mill Products 20.8 11.3 54.4 42.1 15.1 35.8<br />
23 Clothing <strong>and</strong> apparel 18.0 9.6 53.2 34.7 10.2 29.4<br />
24 Lumber <strong>and</strong> Wood Products 17.6 6.4 36.5 46.4 6.5 14.0<br />
25 Furniture <strong>and</strong> Fixtures 11.4 8.2 72.0 53.2 7.5 14.0<br />
26 Paper <strong>and</strong> Allied Products 24.7 10.5 42.6 48.2 12.7 26.3<br />
27 Printing <strong>and</strong> Publishing 84.4 11.4 13.5 28.3 9.3 32.9<br />
28 Chemicals <strong>and</strong> Allied Products 32.6 12.2 37.3 48.3 13.6 28.1<br />
30 Rubber <strong>and</strong> Plastic Products 38.0 11.8 31.2 11.4 6.2 54.7<br />
31 Leather <strong>and</strong> Leather Products 18.9 9.3 49.4 31.2 6.8 21.9<br />
32 Stone. Clay. Glass <strong>and</strong> Concrete Products 21.0 6.5 31.0 55.5 17.8 32.0<br />
33 Primary Metal Industries 61.0 17.8 29.1<br />
22.0 11.2 50.8<br />
34 Fabricated Metal Products<br />
23.8 6.6 27.8<br />
35 Machinery <strong>and</strong> Computer equipment 17.4 13.2 75.8 56.4 11.6 20.6<br />
36 Electronic <strong>and</strong> Other Electrical Equipment 34.4 12.5 36.4 59.6 9.4 15.8<br />
37 Transportation Equipment 19.7 11.0 55.9 32.5 16.5 50.8<br />
38 Medical. precision <strong>and</strong> Optical equipment 13.4 10.1 75.1 73.1 9.2 12.5<br />
39 Miscellaneous Manufacturing Industries 25.1 10.4 41.3 36.1 6.8 18.9<br />
20-39 Total Manufacturing 22.7 9.6 42.5 36.7 10.1 27.4<br />
Sources: relative productivity levels from Table 6 , labour compensation from censuses <strong>of</strong> manufacturing as<br />
described in Text.<br />
9. Conclusion<br />
International comparisons <strong>of</strong> productivity levels by industry <strong>of</strong> origin are a key measure <strong>of</strong> economic<br />
performance next to comparisons <strong>of</strong> per capita income <strong>and</strong> other aggregates measures at the economywide<br />
level. This study assesses the labour productivity gap between Brazil <strong>and</strong> Mexico on the one<br />
h<strong>and</strong> <strong>and</strong> the USA on the other in the mid-1980s. It is an update <strong>of</strong> Maddison <strong>and</strong> van Ark (1994),<br />
who assessed the relative performances <strong>of</strong> these countries in 1975. The paper adopts the ICOP<br />
industry-<strong>of</strong>-origin methodology developed by the <strong>University</strong> <strong>of</strong> <strong>Groningen</strong> <strong>and</strong> refined in collaboration<br />
with CEPII. This method uses relative producer prices, also referred to as unit value ratios (UVRs)<br />
instead <strong>of</strong> exchange rates or proxy PPPs to express the output <strong>of</strong> different countries in a common<br />
currency (here US$). The paper introduced reliability tests for the UVRs using coefficient <strong>of</strong><br />
variation. It turned out that both the UVRs <strong>of</strong> both Brazil/USA <strong>and</strong> Mexico/USA are well within the<br />
confidence intervals, although the variation <strong>of</strong> the former are higher than that <strong>of</strong> the latter bilateral<br />
comparison. Moreover, the representativeness <strong>of</strong> the Mexico/USA comparison is far greater than that<br />
<strong>of</strong> the Brazil/USA comparisons, as the relative price estimates are based on a substantially larger part<br />
<strong>of</strong> output in the latter comparison.<br />
Brazilian productivity in 1985 was 42.5 per cent <strong>of</strong> the US level <strong>and</strong> that <strong>of</strong> Mexico in 1988<br />
27.4 per cent. Large variations across sectors exist with regard to relative productivity levels. The<br />
reliability tests <strong>of</strong> the UVRs indicate that in some branches our measures need to be improved, either<br />
with new product matches or quality adjustments. However, the most problematic issue, which falls<br />
outside the immediate scope <strong>of</strong> the ICOP methodology, concerns the Brazilian time series <strong>of</strong> value<br />
added <strong>and</strong> employment used to extrapolate our benchmark results for the 1970-99 period. In particular<br />
22