glOBal Wind energy OuTlOOk 2010 - Global Wind Energy Council
glOBal Wind energy OuTlOOk 2010 - Global Wind Energy Council
glOBal Wind energy OuTlOOk 2010 - Global Wind Energy Council

You also want an ePaper? Increase the reach of your titles
YUMPU automatically turns print PDFs into web optimized ePapers that Google loves.
R e g i o n a l s c e n a r i o r e s u l T S<br />
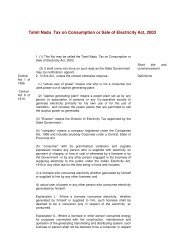
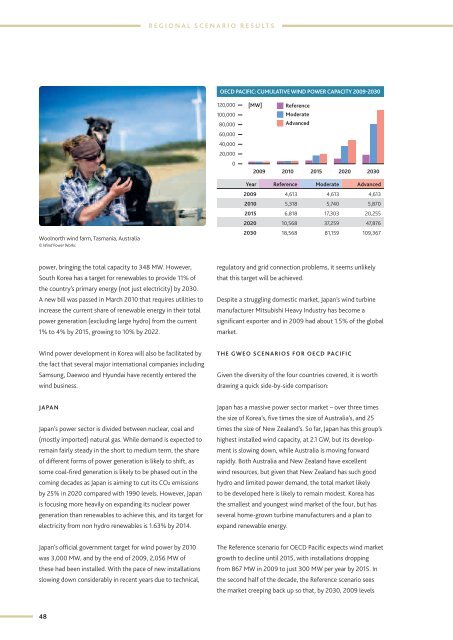
Oecd pacific: cuMulaTive <strong>Wind</strong> POWer capaciTY 2009-2030<br />
120,000<br />
100,000<br />
80,000<br />
60,000<br />
40,000<br />
20,000<br />
0<br />
[MW] Reference<br />
Moderate<br />
Advanced<br />
2009 <strong>2010</strong> 2015 2020 2030<br />
Woolnorth wind farm, Tasmania, Australia<br />
© <strong>Wind</strong> Power Works<br />
Year Reference Moderate Advanced<br />
2009 4,613 4,613 4,613<br />
<strong>2010</strong> 5,318 5,740 5,870<br />
2015 6,818 17,303 20,255<br />
2020 10,568 37,259 47,876<br />
2030 18,568 81,159 109,367<br />
power, bringing the total capacity to 348 MW. However,<br />
South Korea has a target for renewables to provide 11% of<br />
the country’s primary <strong>energy</strong> (not just electricity) by 2030.<br />
A new bill was passed in March <strong>2010</strong> that requires utilities to<br />
increase the current share of renewable <strong>energy</strong> in their total<br />
power generation (excluding large hydro) from the current<br />
1% to 4% by 2015, growing to 10% by 2022.<br />
regulatory and grid connection problems, it seems unlikely<br />
that this target will be achieved.<br />
Despite a struggling domestic market, Japan’s wind turbine<br />
manufacturer Mitsubishi Heavy Industry has become a<br />
significant exporter and in 2009 had about 1.5% of the global<br />
market.<br />
<strong>Wind</strong> power development in Korea will also be facilitated by<br />
the fact that several major international companies including<br />
Samsung, Daewoo and Hyundai have recently entered the<br />
wind business.<br />
The GWEO scenariOS For Oecd Pacific<br />
Given the diversity of the four countries covered, it is worth<br />
drawing a quick side-by-side comparison:<br />
Japan<br />
Japan’s power sector is divided between nuclear, coal and<br />
(mostly imported) natural gas. While demand is expected to<br />
remain fairly steady in the short to medium term, the share<br />
of different forms of power generation is likely to shift, as<br />
some coal-fired generation is likely to be phased out in the<br />
coming decades as Japan is aiming to cut its CO2 emissions<br />
by 25% in 2020 compared with 1990 levels. However, Japan<br />
is focusing more heavily on expanding its nuclear power<br />
generation than renewables to achieve this, and its target for<br />
electricity from non hydro renewables is 1.63% by 2014.<br />
Japan has a massive power sector market – over three times<br />
the size of Korea’s, five times the size of Australia’s, and 25<br />
times the size of New Zealand’s. So far, Japan has this group’s<br />
highest installed wind capacity, at 2.1 GW, but its development<br />
is slowing down, while Australia is moving forward<br />
rapidly. Both Australia and New Zealand have excellent<br />
wind resources, but given that New Zealand has such good<br />
hydro and limited power demand, the total market likely<br />
to be developed here is likely to remain modest. Korea has<br />
the smallest and youngest wind market of the four, but has<br />
several home-grown turbine manufacturers and a plan to<br />
expand renewable <strong>energy</strong>.<br />
Japan’s official government target for wind power by <strong>2010</strong><br />
was 3,000 MW, and by the end of 2009, 2,056 MW of<br />
these had been installed. With the pace of new installations<br />
slowing down considerably in recent years due to technical,<br />
The Reference scenario for OECD Pacific expects wind market<br />
growth to decline until 2015, with installations dropping<br />
from 867 MW in 2009 to just 300 MW per year by 2015. In<br />
the second half of the decade, the Reference scenario sees<br />
the market creeping back up so that, by 2030, 2009 levels<br />
48