glOBal Wind energy OuTlOOk 2010 - Global Wind Energy Council
glOBal Wind energy OuTlOOk 2010 - Global Wind Energy Council
glOBal Wind energy OuTlOOk 2010 - Global Wind Energy Council

You also want an ePaper? Increase the reach of your titles
YUMPU automatically turns print PDFs into web optimized ePapers that Google loves.
T h e G l O B a l W i n d E n e r g y O u t l O O k S c e n a r i O S<br />
Production and share of global electricity supply<br />
Assumptions on turbine capacity…<br />
Individual wind turbines have been steadily growing in terms<br />
of their nameplate capacity – the maximum electricity<br />
output they achieve when operating at full power. While the<br />
average size of turbines still differs dramatically from country<br />
to country, there has been a market trend towards bigger<br />
turbines across all markets. For the purposes of the GWEO<br />
scenarios, this trend is expected to continue over the next<br />
few decades.<br />
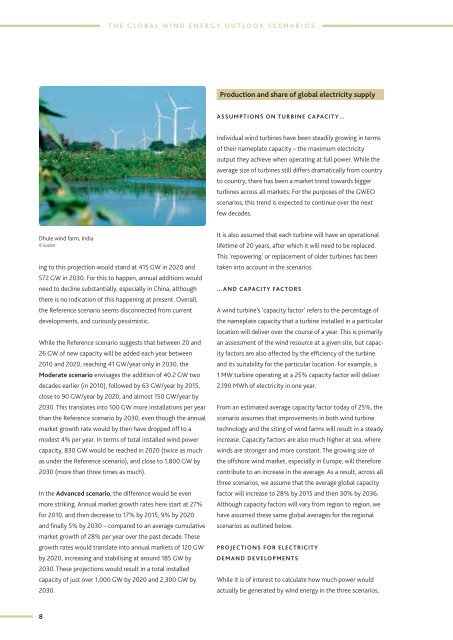
Dhule wind farm, India<br />
© Suzlon<br />
ing to this projection would stand at 415 GW in 2020 and<br />
572 GW in 2030. For this to happen, annual additions would<br />
need to decline substantially, especially in China, although<br />
there is no indication of this happening at present. Overall,<br />
the Reference scenario seems disconnected from current<br />
developments, and curiously pessimistic.<br />
While the Reference scenario suggests that between 20 and<br />
26 GW of new capacity will be added each year between<br />
<strong>2010</strong> and 2020, reaching 41 GW/year only in 2030, the<br />
Moderate scenario envisages the addition of 40.2 GW two<br />
decades earlier (in <strong>2010</strong>), followed by 63 GW/year by 2015,<br />
close to 90 GW/year by 2020, and almost 150 GW/year by<br />
2030. This translates into 100 GW more installations per year<br />
than the Reference scenario by 2030, even though the annual<br />
market growth rate would by then have dropped off to a<br />
modest 4% per year. In terms of total installed wind power<br />
capacity, 830 GW would be reached in 2020 (twice as much<br />
as under the Reference scenario), and close to 1,800 GW by<br />
2030 (more than three times as much).<br />
In the Advanced scenario, the difference would be even<br />
more striking. Annual market growth rates here start at 27%<br />
for <strong>2010</strong>, and then decrease to 17% by 2015, 9% by 2020<br />
and finally 5% by 2030 – compared to an average cumulative<br />
market growth of 28% per year over the past decade. These<br />
growth rates would translate into annual markets of 120 GW<br />
by 2020, increasing and stabilising at around 185 GW by<br />
2030. These projections would result in a total installed<br />
capacity of just over 1,000 GW by 2020 and 2,300 GW by<br />
2030.<br />
It is also assumed that each turbine will have an operational<br />
lifetime of 20 years, after which it will need to be replaced.<br />
This ‘repowering’ or replacement of older turbines has been<br />
taken into account in the scenarios.<br />
… and capacity facTOrs<br />
A wind turbine’s ‘capacity factor’ refers to the percentage of<br />
the nameplate capacity that a turbine installed in a particular<br />
location will deliver over the course of a year. This is primarily<br />
an assessment of the wind resource at a given site, but capacity<br />
factors are also affected by the efficiency of the turbine<br />
and its suitability for the particular location. For example, a<br />
1 MW turbine operating at a 25% capacity factor will deliver<br />
2,190 MWh of electricity in one year.<br />
From an estimated average capacity factor today of 25%, the<br />
scenario assumes that improvements in both wind turbine<br />
technology and the siting of wind farms will result in a steady<br />
increase. Capacity factors are also much higher at sea, where<br />
winds are stronger and more constant. The growing size of<br />
the offshore wind market, especially in Europe, will therefore<br />
contribute to an increase in the average. As a result, across all<br />
three scenarios, we assume that the average global capacity<br />
factor will increase to 28% by 2015 and then 30% by 2036.<br />
Although capacity factors will vary from region to region, we<br />
have assumed these same global averages for the regional<br />
scenarios as outlined below.<br />
Projections FOr electricity<br />
demand developmenTS<br />
While it is of interest to calculate how much power would<br />
actually be generated by wind <strong>energy</strong> in the three scenarios,<br />
8