Salmon Spawning Ground Surveys, 1989-92 Project F-73-R-15
Salmon Spawning Ground Surveys, 1989-92 Project F-73-R-15
Salmon Spawning Ground Surveys, 1989-92 Project F-73-R-15

Create successful ePaper yourself
Turn your PDF publications into a flip-book with our unique Google optimized e-Paper software.
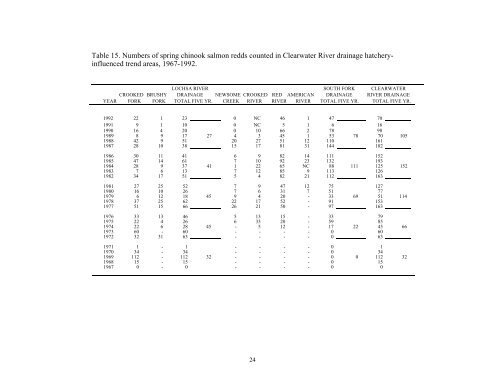
Table <strong>15</strong>. Numbers of spring chinook salmon redds counted in Clearwater River drainage hatcheryinfluenced<br />
trend areas, 1967-19<strong>92</strong>.<br />
LOCHSA RIVER SOUTH FORK CLEARWATER<br />
CROOKED BRUSHY DRAINAGE NEWSOME CROOKED RED AMERICAN DRAINAGE RIVER DRAINAGE<br />
YEAR FORK FORK TOTAL FIVE YR. CREEK RIVER RIVER RIVER TOTAL FIVE YR. TOTAL FIVE YR.<br />
19<strong>92</strong> 22 1 23 0 NC 46 1 47 70<br />
1991 9 1 10 0 NC 5 1 6 16<br />
1990 16 4 20 0 10 66 2 78 98<br />
<strong>1989</strong> 8 9 17 27 4 3 45 1 53 78 70 105<br />
1988 42 9 51 20 27 51 12 110 161<br />
1987 28 10 38 <strong>15</strong> 17 81 31 144 182<br />
1986 30 11 41 6 9 82 14 111 <strong>15</strong>2<br />
1985 47 14 61 7 10 <strong>92</strong> 23 132 193<br />
1984 28 9 37 41 1 22 65 NC 88 111 125 <strong>15</strong>2<br />
1983 7 6 13 7 12 85 9 113 126<br />
1982 34 17 51 5 4 82 21 112 163<br />
1981 27 25 52 7 9 47 12 75 127<br />
1980 16 10 26 7 6 31 7 51 77<br />
1979 6 12 18 45 9 4 20 - 33 69 51 114<br />
1978 37 25 62 22 17 52 - 91 <strong>15</strong>3<br />
1977 51 <strong>15</strong> 66 26 21 50 - 97 163<br />
1976 33 13 46 5 13 <strong>15</strong> - 33 79<br />
1975 22 4 26 6 33 20 - 59 85<br />
1974 22 6 28 45 - 5 12 - 17 22 45 66<br />
19<strong>73</strong> 60 - 60 - - - - 0 60<br />
1972 32 31 63 - - - - 0 63<br />
1971 1 - 1 - - - - 0 1<br />
1970 34 - 34 - - - - 0 34<br />
1969 112 - 112 32 - - - - 0 0 112 32<br />
1968 <strong>15</strong> - <strong>15</strong> - - - - 0 <strong>15</strong><br />
1967 0 - 0 - - - - 0 0<br />
24