Salmon Spawning Ground Surveys, 1989-92 Project F-73-R-15
Salmon Spawning Ground Surveys, 1989-92 Project F-73-R-15
Salmon Spawning Ground Surveys, 1989-92 Project F-73-R-15
Create successful ePaper yourself
Turn your PDF publications into a flip-book with our unique Google optimized e-Paper software.
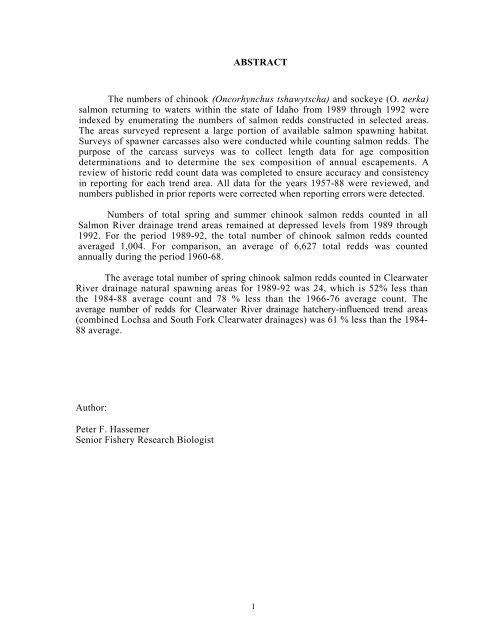
ABSTRACT<br />
The numbers of chinook (Oncorhynchus tshawytscha) and sockeye (O. nerka)<br />
salmon returning to waters within the state of Idaho from <strong>1989</strong> through 19<strong>92</strong> were<br />
indexed by enumerating the numbers of salmon redds constructed in selected areas.<br />
The areas surveyed represent a large portion of available salmon spawning habitat.<br />
<strong>Surveys</strong> of spawner carcasses also were conducted while counting salmon redds. The<br />
purpose of the carcass surveys was to collect length data for age composition<br />
determinations and to determine the sex composition of annual escapements. A<br />
review of historic redd count data was completed to ensure accuracy and consistency<br />
in reporting for each trend area. All data for the years 1957-88 were reviewed, and<br />
numbers published in prior reports were corrected when reporting errors were detected.<br />
Numbers of total spring and summer chinook salmon redds counted in all<br />
<strong>Salmon</strong> River drainage trend areas remained at depressed levels from <strong>1989</strong> through<br />
19<strong>92</strong>. For the period <strong>1989</strong>-<strong>92</strong>, the total number of chinook salmon redds counted<br />
averaged 1,004. For comparison, an average of 6,627 total redds was counted<br />
annually during the period 1960-68.<br />
The average total number of spring chinook salmon redds counted in Clearwater<br />
River drainage natural spawning areas for <strong>1989</strong>-<strong>92</strong> was 24, which is 52% less than<br />
the 1984-88 average count and 78 % less than the 1966-76 average count. The<br />
average number of redds for Clearwater River drainage hatchery-influenced trend areas<br />
(combined Lochsa and South Fork Clearwater drainages) was 61 % less than the 1984-<br />
88 average.<br />
Author:<br />
Peter F. Hassemer<br />
Senior Fishery Research Biologist<br />
1


