Computational Mechanics Research and Support for Aerodynamics ...
Computational Mechanics Research and Support for Aerodynamics ...
Computational Mechanics Research and Support for Aerodynamics ...
- No tags were found...

You also want an ePaper? Increase the reach of your titles
YUMPU automatically turns print PDFs into web optimized ePapers that Google loves.
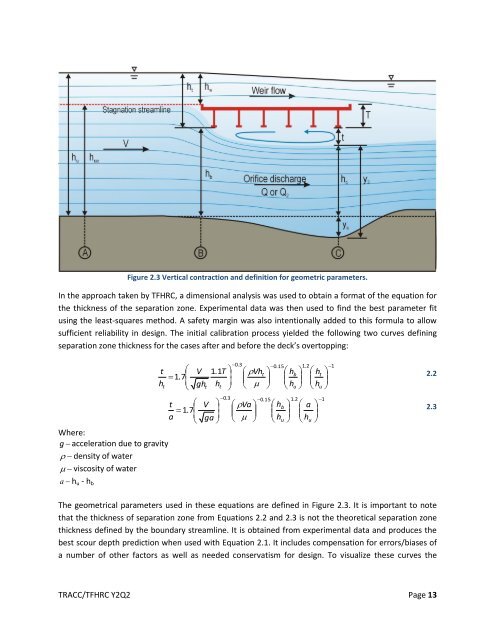
Figure 2.3 Vertical contraction <strong>and</strong> definition <strong>for</strong> geometric parameters.<br />
In the approach taken by TFHRC, a dimensional analysis was used to obtain a <strong>for</strong>mat of the equation <strong>for</strong><br />
the thickness of the separation zone. Experimental data was then used to find the best parameter fit<br />
using the least-squares method. A safety margin was also intentionally added to this <strong>for</strong>mula to allow<br />
sufficient reliability in design. The initial calibration process yielded the following two curves defining<br />
separation zone thickness <strong>for</strong> the cases after <strong>and</strong> be<strong>for</strong>e the deck’s overtopping:<br />
t<br />
h<br />
Where:<br />
g acceleration due to gravity<br />
density of water<br />
viscosity of water<br />
a h u - h b<br />
t<br />
<br />
1.<br />
7<br />
<br />
t<br />
a<br />
<br />
1.<br />
7<br />
<br />
V<br />
gh<br />
t<br />
1.<br />
1T<br />
<br />
<br />
h<br />
t <br />
V <br />
<br />
ga<br />
<br />
0.<br />
3<br />
0.<br />
3<br />
0.<br />
15<br />
1.<br />
2<br />
1<br />
Vh<br />
<br />
t<br />
h<br />
<br />
b h<br />
<br />
<br />
<br />
t<br />
<br />
2.2<br />
hu<br />
hu<br />
<br />
0.<br />
15<br />
1.<br />
2<br />
1<br />
Va<br />
hb<br />
a <br />
<br />
<br />
<br />
<br />
<br />
2.3<br />
hu<br />
hu<br />
<br />
The geometrical parameters used in these equations are defined in Figure 2.3. It is important to note<br />
that the thickness of separation zone from Equations 2.2 <strong>and</strong> 2.3 is not the theoretical separation zone<br />
thickness defined by the boundary streamline. It is obtained from experimental data <strong>and</strong> produces the<br />
best scour depth prediction when used with Equation 2.1. It includes compensation <strong>for</strong> errors/biases of<br />
a number of other factors as well as needed conservatism <strong>for</strong> design. To visualize these curves the<br />
TRACC/TFHRC Y2Q2 Page 13