380000 tonnes fresh products - Bama
380000 tonnes fresh products - Bama
380000 tonnes fresh products - Bama
- No tags were found...

Create successful ePaper yourself
Turn your PDF publications into a flip-book with our unique Google optimized e-Paper software.
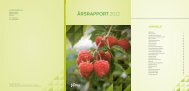
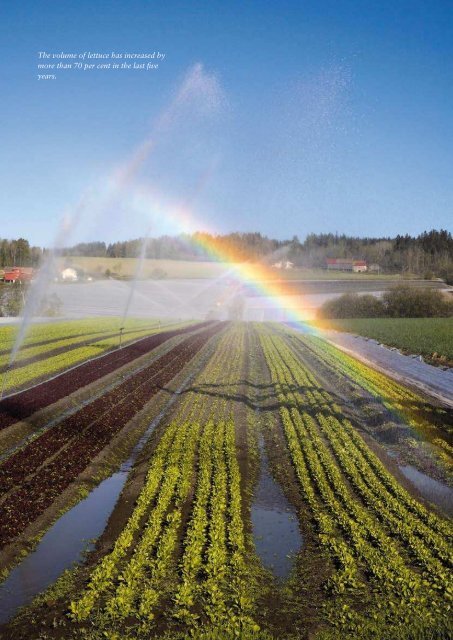
The volume of lettuce has increased by<br />
more than 70 per cent in the last five<br />
years.<br />
Amount in NOK thousand<br />
PARENT COMPANY<br />
GROUP<br />
2005 2006 CASH FLOW STATEMENT 2006 2005<br />
CASH FLOWS FROM OPERATIONAL ACTIVITIES<br />
120 925 174 465 Profit before tax 375 836 312 330<br />
-31 051 -26 799 Tax paid during the period 91 291 -90 692<br />
-2 288 -1 641 Gain/loss on sale of fixed assets 31 687 -5 651<br />
44 435 42 478 Depreciation and write-downs 118 837 113 468<br />
-4 843 -4 258 Change in stocks 15 849 -19 169<br />
-51 111 -60 779 Change in accounts receivable 74 933 -68 258<br />
77 815 -3 253 Change in payables to suppliers 17 745 76 655<br />
25 603 100 824 Change in other accruals 137 379 21 621<br />
179 485 221 037 NET CASH FLOW FROM OPERATIONAL ACTIVITIES 436 037 340 304<br />
CASH FLOWS FROM INVESTMENT ACTIVITIES<br />
-24 295 -27 233 Investments in tangible fixed assets/additions from new group companies 244 782 -118 253<br />
5 749 3 353 Sale of fixed assets/disposals from outgoing group companies 52 439 11 993<br />
-3 007 -43 436 Change in other investments 3 162 -688<br />
-21 553 -67 316 Net cash flow from investment activities 189 181 -106 948<br />
CASH FLOWS FROM FINANCING ACTIVITIES<br />
-6 872 -2 961 Change in long-term liabilities 32 704 -45 516<br />
-414 0 Change in equity through merger 0 0<br />
Change in equity as a result of changes in the group<br />
0 0 composition and ownership interests in group companies 9 591 6 555<br />
Change in minority interests as a result of changes in the<br />
0 0 group composition and ownership interests in group companies 1 240 4 888<br />
-100 000 -130 000 Dividends paid 178 793 -131 891<br />
-107 286 -132 961 Net cash flow from financing activities 200 666 -165 964<br />
50 646 20 760 Total change in liquid assets 46 190 67 392<br />
67 033 117 679 Liquid assets as of 1/1 288 527 221 135<br />
117 679 138 439 Liquid assets as of 31/12 334 717 288 527<br />
BAMA Annual Report 06<br />
31