and the Efficacy of Pit Latrine Additives - Water Research Commission
and the Efficacy of Pit Latrine Additives - Water Research Commission
and the Efficacy of Pit Latrine Additives - Water Research Commission
- No tags were found...

You also want an ePaper? Increase the reach of your titles
YUMPU automatically turns print PDFs into web optimized ePapers that Google loves.
The st<strong>and</strong>ard deviations in this batch are high, <strong>the</strong>reby limiting <strong>the</strong> conclusions that can be drawn from <strong>the</strong><br />
results.<br />
Figure AB.4 presents all cumulative gas production data from batches 1, 2 <strong>and</strong> 3 from Set 1.<br />
2.3 Overall analysis <strong>of</strong> Set 1 experiments<br />
In this section, <strong>the</strong> results <strong>of</strong> batches 1, 2 <strong>and</strong> 3 are combined <strong>and</strong> analysed to see if <strong>the</strong>re is are any general<br />
trends that may be observed.<br />
2.3.1 General observations<br />
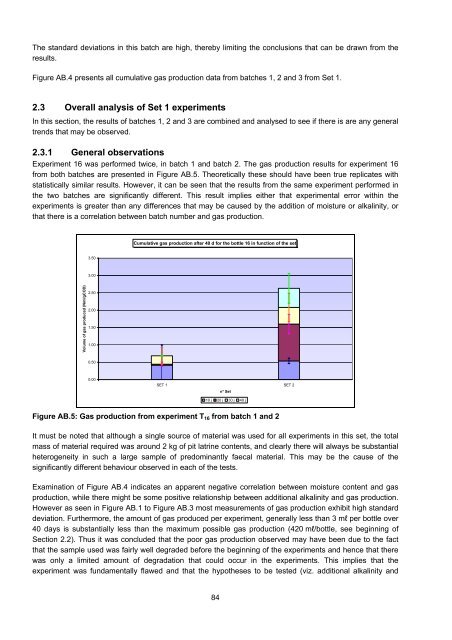
Experiment 16 was performed twice, in batch 1 <strong>and</strong> batch 2. The gas production results for experiment 16<br />
from both batches are presented in Figure AB.5. Theoretically <strong>the</strong>se should have been true replicates with<br />
statistically similar results. However, it can be seen that <strong>the</strong> results from <strong>the</strong> same experiment performed in<br />
<strong>the</strong> two batches are significantly different. This result implies ei<strong>the</strong>r that experimental error within <strong>the</strong><br />
experiments is greater than any differences that may be caused by <strong>the</strong> addition <strong>of</strong> moisture or alkalinity, or<br />
that <strong>the</strong>re is a correlation between batch number <strong>and</strong> gas production.<br />
Cumulative gas production after 40 d for <strong>the</strong> bottle 16 in function <strong>of</strong> <strong>the</strong> set<br />
3.50<br />
3.00<br />
Volume <strong>of</strong> gas produced (Nml/gCOD)<br />
2.50<br />
2.00<br />
1.50<br />
1.00<br />
0.50<br />
0.00<br />
SET 1 SET 2<br />
n° Set<br />
10 j 20 j 30 j 40 j<br />
Figure AB.5: Gas production from experiment T 16 from batch 1 <strong>and</strong> 2<br />
It must be noted that although a single source <strong>of</strong> material was used for all experiments in this set, <strong>the</strong> total<br />
mass <strong>of</strong> material required was around 2 kg <strong>of</strong> pit latrine contents, <strong>and</strong> clearly <strong>the</strong>re will always be substantial<br />
heterogeneity in such a large sample <strong>of</strong> predominantly faecal material. This may be <strong>the</strong> cause <strong>of</strong> <strong>the</strong><br />
significantly different behaviour observed in each <strong>of</strong> <strong>the</strong> tests.<br />
Examination <strong>of</strong> Figure AB.4 indicates an apparent negative correlation between moisture content <strong>and</strong> gas<br />
production, while <strong>the</strong>re might be some positive relationship between additional alkalinity <strong>and</strong> gas production.<br />
However as seen in Figure AB.1 to Figure AB.3 most measurements <strong>of</strong> gas production exhibit high st<strong>and</strong>ard<br />
deviation. Fur<strong>the</strong>rmore, <strong>the</strong> amount <strong>of</strong> gas produced per experiment, generally less than 3 ml per bottle over<br />
40 days is substantially less than <strong>the</strong> maximum possible gas production (420 ml/bottle, see beginning <strong>of</strong><br />
Section 2.2). Thus it was concluded that <strong>the</strong> poor gas production observed may have been due to <strong>the</strong> fact<br />
that <strong>the</strong> sample used was fairly well degraded before <strong>the</strong> beginning <strong>of</strong> <strong>the</strong> experiments <strong>and</strong> hence that <strong>the</strong>re<br />
was only a limited amount <strong>of</strong> degradation that could occur in <strong>the</strong> experiments. This implies that <strong>the</strong><br />
experiment was fundamentally flawed <strong>and</strong> that <strong>the</strong> hypo<strong>the</strong>ses to be tested (viz. additional alkalinity <strong>and</strong><br />
84