and the Efficacy of Pit Latrine Additives - Water Research Commission
and the Efficacy of Pit Latrine Additives - Water Research Commission
and the Efficacy of Pit Latrine Additives - Water Research Commission
- No tags were found...

Create successful ePaper yourself
Turn your PDF publications into a flip-book with our unique Google optimized e-Paper software.
acteria will increase with temperature, <strong>and</strong> increase with decreasing moisture content. The rate <strong>of</strong> pathogen<br />
deactivation also depends on <strong>the</strong> pH value in <strong>the</strong> treatment system. A thorough review <strong>of</strong> pathogen die-<strong>of</strong>f in<br />
septic <strong>and</strong> subsurface soakaway systems may be found in <strong>the</strong> USEPA Onsite wastewater treatment systems<br />
manual (USEPA, 2002).<br />
Feachem et al. (1983) conclude that pit latrine contents that have been left undisturbed for one year would<br />
be virtually pathogen free “apart from a few Ascaris eggs”. However, <strong>the</strong>se authors caution that <strong>the</strong> top layer<br />
<strong>of</strong> <strong>the</strong> pit contents <strong>of</strong> a pit in use will contain pathogenic micro-organisms, irrespective <strong>of</strong> <strong>the</strong> rate <strong>of</strong> die-<strong>of</strong>f or<br />
<strong>the</strong> overall age <strong>of</strong> <strong>the</strong> pit. Cotton et al. (1995) quote a review by Lewis in which <strong>the</strong> key findings were that<br />
2 m <strong>of</strong> s<strong>and</strong> <strong>and</strong> loam between <strong>the</strong> bottom <strong>of</strong> a pit <strong>and</strong> <strong>the</strong> water table is enough to remove all bacteria, virus<br />
<strong>and</strong> o<strong>the</strong>r faecal organisms<br />
2.2 Non-biological processes in a pit latrine<br />
Two physical processes <strong>of</strong> a pit latrine can be characterised: (i) <strong>the</strong> filling <strong>of</strong> <strong>the</strong> pit with waste; <strong>and</strong> (ii) <strong>the</strong><br />
hydraulic flow patterns into <strong>and</strong> out <strong>of</strong> <strong>the</strong> reactor via <strong>the</strong> walls <strong>and</strong> base <strong>of</strong> <strong>the</strong> pit.<br />
2.2.1 Filling rates<br />
There have been several studies on pit filling rates. Still (2002) reviewed four studies (three in South Africa,<br />
including Norris (2000) <strong>and</strong> one in Tanzania <strong>and</strong> Botswana). Reported filling rates varied from 10.0 to<br />
120.5 l /(ca.annum) (litres per capita per annum). The most important factors affecting <strong>the</strong>se rates were<br />
understood to be drainage from <strong>the</strong> pit <strong>and</strong> <strong>the</strong> extent to which pits are used for disposal <strong>of</strong> o<strong>the</strong>r household<br />
waste. Number <strong>of</strong> users was also stated to be a factor; it is assumed that <strong>the</strong> number <strong>of</strong> users affects <strong>the</strong> net<br />
filling rate (l/annum) but has no effect on <strong>the</strong> specific filling rate (l/ca.annum).<br />
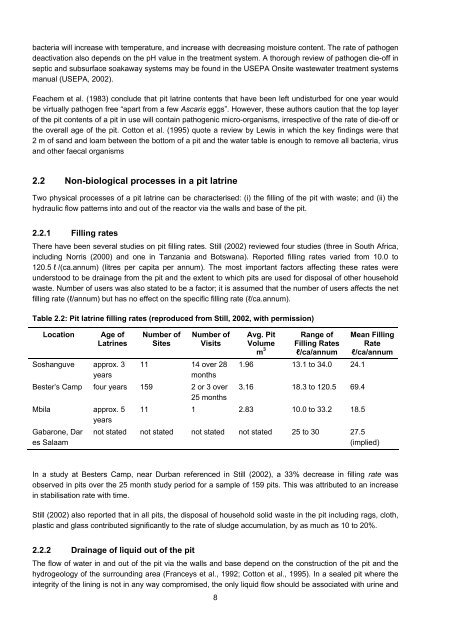
Table 2.2: <strong>Pit</strong> latrine filling rates (reproduced from Still, 2002, with permission)<br />
Location<br />
Age <strong>of</strong><br />
<strong>Latrine</strong>s<br />
Soshanguve approx. 3<br />
years<br />
Number <strong>of</strong><br />
Sites<br />
Number <strong>of</strong><br />
Visits<br />
11 14 over 28<br />
months<br />
Avg. <strong>Pit</strong><br />
Volume<br />
m 3<br />
Range <strong>of</strong><br />
Filling Rates<br />
l/ca/annum<br />
1.96 13.1 to 34.0 24.1<br />
Bester’s Camp four years 159 2 or 3 over 3.16 18.3 to 120.5 69.4<br />
25 months<br />
Mbila approx. 5<br />
years<br />
11 1 2.83 10.0 to 33.2 18.5<br />
Gabarone, Dar<br />
es Salaam<br />
Mean Filling<br />
Rate<br />
l/ca/annum<br />
not stated not stated not stated not stated 25 to 30 27.5<br />
(implied)<br />
In a study at Besters Camp, near Durban referenced in Still (2002), a 33% decrease in filling rate was<br />
observed in pits over <strong>the</strong> 25 month study period for a sample <strong>of</strong> 159 pits. This was attributed to an increase<br />
in stabilisation rate with time.<br />
Still (2002) also reported that in all pits, <strong>the</strong> disposal <strong>of</strong> household solid waste in <strong>the</strong> pit including rags, cloth,<br />
plastic <strong>and</strong> glass contributed significantly to <strong>the</strong> rate <strong>of</strong> sludge accumulation, by as much as 10 to 20%.<br />
2.2.2 Drainage <strong>of</strong> liquid out <strong>of</strong> <strong>the</strong> pit<br />
The flow <strong>of</strong> water in <strong>and</strong> out <strong>of</strong> <strong>the</strong> pit via <strong>the</strong> walls <strong>and</strong> base depend on <strong>the</strong> construction <strong>of</strong> <strong>the</strong> pit <strong>and</strong> <strong>the</strong><br />
hydrogeology <strong>of</strong> <strong>the</strong> surrounding area (Franceys et al., 1992; Cotton et al., 1995). In a sealed pit where <strong>the</strong><br />
integrity <strong>of</strong> <strong>the</strong> lining is not in any way compromised, <strong>the</strong> only liquid flow should be associated with urine <strong>and</strong><br />
8