Kingscote Airport Master Plan Apr 2010 - Kangaroo Island Council
Kingscote Airport Master Plan Apr 2010 - Kangaroo Island Council
Kingscote Airport Master Plan Apr 2010 - Kangaroo Island Council

Create successful ePaper yourself
Turn your PDF publications into a flip-book with our unique Google optimized e-Paper software.
KINGSCOTE AIRPORT MASTER PLAN<br />
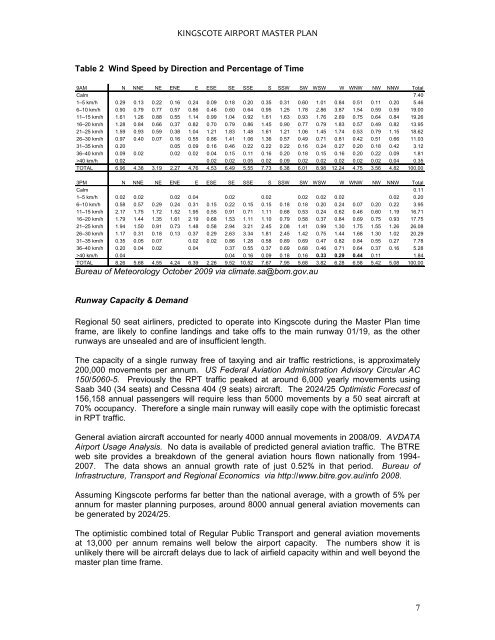
Table 2 Wind Speed by Direction and Percentage of Time<br />
9AM N NNE NE ENE E ESE SE SSE S SSW SW WSW W WNW NW NNW Total<br />
Calm 7.40<br />
1–5 km/h 0.29 0.13 0.22 0.16 0.24 0.09 0.18 0.20 0.35 0.31 0.60 1.01 0.84 0.51 0.11 0.20 5.46<br />
6–10 km/h 0.90 0.79 0.77 0.57 0.86 0.46 0.60 0.64 0.95 1.25 1.78 2.86 3.87 1.54 0.59 0.59 19.00<br />
11–15 km/h 1.61 1.26 0.88 0.55 1.14 0.99 1.04 0.92 1.61 1.63 0.93 1.76 2.69 0.75 0.64 0.84 19.26<br />
16–20 km/h 1.28 0.84 0.66 0.37 0.82 0.70 0.79 0.86 1.45 0.90 0.77 0.79 1.83 0.57 0.49 0.82 13.95<br />
21–25 km/h 1.59 0.93 0.59 0.38 1.04 1.21 1.83 1.48 1.61 1.21 1.06 1.45 1.74 0.53 0.79 1.15 18.62<br />
26–30 km/h 0.97 0.40 0.07 0.16 0.55 0.86 1.41 1.06 1.36 0.57 0.49 0.71 0.81 0.42 0.51 0.66 11.03<br />
31–35 km/h 0.20 0.05 0.09 0.16 0.46 0.22 0.22 0.22 0.16 0.24 0.27 0.20 0.18 0.42 3.12<br />
36–40 km/h 0.09 0.02 0.02 0.02 0.04 0.15 0.11 0.16 0.20 0.18 0.15 0.16 0.20 0.22 0.09 1.81<br />
>40 km/h 0.02 0.02 0.02 0.05 0.02 0.09 0.02 0.02 0.02 0.02 0.02 0.04 0.35<br />
TOTAL 6.96 4.38 3.19 2.27 4.76 4.53 6.49 5.55 7.73 6.38 6.01 8.98 12.24 4.75 3.56 4.82 100.00<br />
3PM N NNE NE ENE E ESE SE SSE S SSW SW WSW W WNW NW NNW Total<br />
Calm 0.11<br />
1–5 km/h 0.02 0.02 0.02 0.04 0.02 0.02 0.02 0.02 0.02 0.02 0.20<br />
6–10 km/h 0.58 0.57 0.29 0.24 0.31 0.15 0.22 0.15 0.15 0.18 0.18 0.20 0.24 0.07 0.20 0.22 3.95<br />
11–15 km/h 2.17 1.75 1.72 1.52 1.95 0.55 0.91 0.71 1.11 0.68 0.53 0.24 0.62 0.46 0.60 1.19 16.71<br />
16–20 km/h 1.79 1.44 1.35 1.61 2.19 0.68 1.53 1.11 1.10 0.79 0.58 0.37 0.84 0.69 0.75 0.93 17.75<br />
21–25 km/h 1.94 1.50 0.91 0.73 1.48 0.58 2.94 3.21 2.45 2.08 1.41 0.99 1.30 1.75 1.55 1.26 26.08<br />
26–30 km/h 1.17 0.31 0.18 0.13 0.37 0.29 2.63 3.34 1.81 2.45 1.42 0.75 1.44 1.68 1.30 1.02 20.29<br />
31–35 km/h 0.35 0.05 0.07 0.02 0.02 0.86 1.28 0.58 0.89 0.69 0.47 0.82 0.84 0.55 0.27 7.78<br />
36–40 km/h 0.20 0.04 0.02 0.04 0.37 0.55 0.37 0.69 0.68 0.46 0.71 0.64 0.37 0.16 5.28<br />
>40 km/h 0.04 0.04 0.16 0.09 0.18 0.16 0.33 0.29 0.44 0.11 1.84<br />
TOTAL 8.26 5.68 4.55 4.24 6.39 2.26 9.52 10.52 7.67 7.95 5.68 3.82 6.28 6.58 5.42 5.08<br />
Bureau of Meteorology October 2009 via climate.sa@bom.gov.au<br />
100.00<br />
Runway Capacity & Demand<br />
Regional 50 seat airliners, predicted to operate into <strong>Kingscote</strong> during the <strong>Master</strong> <strong>Plan</strong> time<br />
frame, are likely to confine landings and take offs to the main runway 01/19, as the other<br />
runways are unsealed and are of insufficient length.<br />
The capacity of a single runway free of taxying and air traffic restrictions, is approximately<br />
200,000 movements per annum. US Federal Aviation Administration Advisory Circular AC<br />
150/5060-5. Previously the RPT traffic peaked at around 6,000 yearly movements using<br />
Saab 340 (34 seats) and Cessna 404 (9 seats) aircraft. The 2024/25 Optimistic Forecast of<br />
156,158 annual passengers will require less than 5000 movements by a 50 seat aircraft at<br />
70% occupancy. Therefore a single main runway will easily cope with the optimistic forecast<br />
in RPT traffic.<br />
General aviation aircraft accounted for nearly 4000 annual movements in 2008/09. AVDATA<br />
<strong>Airport</strong> Usage Analysis. No data is available of predicted general aviation traffic. The BTRE<br />
web site provides a breakdown of the general aviation hours flown nationally from 1994-<br />
2007. The data shows an annual growth rate of just 0.52% in that period. Bureau of<br />
Infrastructure, Transport and Regional Economics via http://www.bitre.gov.au/info 2008.<br />
Assuming <strong>Kingscote</strong> performs far better than the national average, with a growth of 5% per<br />
annum for master planning purposes, around 8000 annual general aviation movements can<br />
be generated by 2024/25.<br />
The optimistic combined total of Regular Public Transport and general aviation movements<br />
at 13,000 per annum remains well below the airport capacity. The numbers show it is<br />
unlikely there will be aircraft delays due to lack of airfield capacity within and well beyond the<br />
master plan time frame.<br />
7