Kingscote Airport Business Case Appendices - Kangaroo Island ...
Kingscote Airport Business Case Appendices - Kangaroo Island ...
Kingscote Airport Business Case Appendices - Kangaroo Island ...
- No tags were found...

You also want an ePaper? Increase the reach of your titles
YUMPU automatically turns print PDFs into web optimized ePapers that Google loves.
PRELIMINARY ASSESSMENT<strong>Kangaroo</strong> <strong>Island</strong> Air Passenger DemandBoth air and sea links to <strong>Kangaroo</strong> <strong>Island</strong> currently have sole providers – Regional Express Airlines(“Rex”) and SeaLink respectively – and with each serving a single mainland destination – Adelaide<strong>Airport</strong> and Cape Jervis. Both modes of access have seen other providers in recent years, howevercurrent operate without competition (with the key exception of competition between the twomodes of access). While <strong>Kangaroo</strong> <strong>Island</strong> has seen an increase in visitation, the corresponding periodhas seen a clear decline in air passengers at KGC, as shown in the chart below.Contrasting with visitor growth to <strong>Kangaroo</strong> <strong>Island</strong>, air passengers at KGC have fallen at a compoundannual rate of ‐4.5% per year to 46,000 passengers in 2011. This passenger volume is served by 2‐4daily flights to Adelaide by Rex’s 34‐seat Saab 340 aircraft.Page| 3
PRELIMINARY ASSESSMENT<strong>Kangaroo</strong> <strong>Island</strong> Air Passenger Demandon Tourism Forecasting Committee forecast growth and the origins of <strong>Kangaroo</strong> <strong>Island</strong>’s visitor mix,provided by SATC. The growth assumptions used for each visitor market are detailed in the tablebelow:Market Annual Growth Market Annual GrowthDomestic 0.3‐1.3% p.a. Germany 0.3‐3.4% p.a.New Zealand 1.5‐2.4% p.a. UK ‐0.8‐3.5% p.a.Asia 3.8‐12.6% p.a. Other Europe ‐0.1‐4.5% p.a.USA/Canada 1.3‐4.5% p.a. Other 3.1‐4.7% p.a.The high‐growth scenario sees growth rising from the current 2.9% p.a. to 5.2% 2 p.a. by 2020, andreturning to 2.9% by 2030.Based on this forecast growth in visitation, PAC then estimated the likely share of visitors travellingto <strong>Kangaroo</strong> <strong>Island</strong> by air. The recent falling trend in the number of visitors travelling by air is alsoaccompanied by a fall in the share of visitors travelling by air: In the past ten years, the number ofpassengers at KGC 3 has fallen from 25% of total visitor movements to 12%.2 Australian domestic passenger growth for the past 10 years has shown a compound annual growth rate of5.2%3 Noting, of course, that some of these passengers are resident (rather than visitor) movementsPage| 5
PRELIMINARY ASSESSMENT<strong>Kangaroo</strong> <strong>Island</strong> Air Passenger DemandPAC has assumed that a “double” mid‐case scenario – that is, a mid‐case of visitor growth and a midcaseof air travel demand share of visitors – should form the basis of assessments of likely demandfor air services. Under these scenarios, current demand is sufficient to warrant 2‐3 daily Saab 340flights (consistent with the current offering by Rex). Assuming a continuation of these scenarios, afourth daily Saab 340 would be sustained by demand in 2016, and a fifth in 2018.Assuming a second entrant to the <strong>Kangaroo</strong> <strong>Island</strong>‐Adelaide market, and ongoing services by theincumbent carrier, PAC’s modelling shows that a double mid‐case scenario would support a threetimesdaily Saab 340 service and a daily 70‐seat service (such as an ATR72) by 2018. PAC notes thatKGC’s existing infrastructure appears insufficient to cater for this outcome. By 2023, PAC’s modellingshows that KGC demand could support three‐times daily Saab 340 services and twice‐daily 70‐seatservices.<strong>Kangaroo</strong> <strong>Island</strong>‐Melbourne DemandPAC has also considered the likely demand, and timeframe for implementation, of flights to<strong>Kangaroo</strong> <strong>Island</strong>’s next‐nearest major market (after Adelaide) – Melbourne. PAC has assessed thelikely demand for a Melbourne flight from each visitor source market: For instance, it has beenassumed that the Victoria‐<strong>Kangaroo</strong> <strong>Island</strong> visitor market would experience demand stimulation,with air passenger demand representing 40% of post‐stimulation visitor numbers. Foreign marketsare also expected to be significant sources of demand for a Melbourne service, given the significantinternational connections offered at Melbourne <strong>Airport</strong> – considerably more than exist at Adelaide<strong>Airport</strong>. With these assumptions, it is expected that, following stimulation, there is sufficient existingdemand to support a daily Melbourne service using Q300 equipment 5 , or a 70‐seat service by 2016.5 Without stimulation, Melbourne market demand is likely to support a daily Q300 service by 2015.Page| 7
PRELIMINARY ASSESSMENT<strong>Kangaroo</strong> <strong>Island</strong> Air Passenger DemandInfrastructure ImplicationsPAC’s modelling has assumed that <strong>Kangaroo</strong> <strong>Island</strong> can continue its strong performance in visitorgrowth, and turn around the decline in air passenger demand. PAC recognises that these are strongassumptions, and in the case of air passenger demand, represent a departure from current trends.Nonetheless, with the mid‐case scenarios employed, it is clear that KGC will face significant pressureon existing infrastructure within the next 5‐10 years. It is likely that there will be demand to supporta 70‐seat operator by 2016‐2018, either as a competitor to existing services to Adelaide or with anew service to Melbourne.The lack of adequate infrastructure (including runway, terminal and security considerations) at KGC,however, is an absolute inhibitor of these scenarios being realised. PAC considers it unlikely that analternative scenario whereby the incumbent (Rex) increases frequency to cater for expected demandto six or seven daily flights will occur. If competition is to occur, it will likely occur with aircraftcurrently too large and heavy for KGC’s infrastructure. Without air competition, the currentdownward trend in air travel is likely to continue due to the incumbent’s higher cost base (resultingin higher fares), limited network connectivity to major source markets and monopoly position.The counter‐factual scenario – or the ‘low‐low’ scenario – shows that current capacity to Adelaide islikely to be sufficient to cater for expected low‐growth demand, and demand will remain insufficientto warrant competitor entry. By contrast, Melbourne demand is likely to support an ATR72 flight by2019 under a ‘low‐low’ scenario, implying similar infrastructure needs.ConclusionBased on the modelling undertaken by PAC, and the information provided to PAC, <strong>Kangaroo</strong> <strong>Island</strong>faces a critical infrastructure ‘crunch’ in the next five to ten years. It is expected that demand for aATR72/Q400 service will exist by 2019, under even the most conservative of scenarios 6 . Of course,there is no guarantee that any operator will necessarily allocate aircraft for this opportunity shouldthe demand exist, however KGC’s inability to cater for this aircraft would certainly close theopportunity of either a Melbourne service or competition on the Adelaide route.6 Furthermore, the incumbent operator (Rex) is likely to consider airframe replacement for Saab 340 aircraft inthe 5‐10 year horizon. It is not known what aircraft are likely to be considered as replacement airframes,however there are no aircraft in the 30‐50 seat size range currently being manufactured – therefore, it is likelythat Rex will need to consider larger aircraft than its existing Saab 340 aircraft.Page| 8
PRELIMINARY ASSESSMENT<strong>Kangaroo</strong> <strong>Island</strong> Air Passenger DemandConsequently, PAC considers it prudent for KIC, KIFA and SATC to consider the infrastructure needsto allow ATR72/Q400 operations 7 at KGC – and the return on that investment – as a matter ofstrategic importance for <strong>Kangaroo</strong> <strong>Island</strong>.PAC recommends that KIC advance its assessment of the value of this infrastructure investmentthrough a detailed investigation of the costs involved in accommodating larger aircraft such as theQ400. As part of this, KIC should assess the likely return on investment of additional infrastructureinvestment, proceeding along the following lines:a. The level of investment required to maintain KGC on an as‐is basis without any deteriorationin runway or pavement gradeb. The level of investment required to accommodate ATR72 & Q400 aircraft operating sectorsas far as Melbourne (the level of investment identified by PAC’s analysis)c. The level of investment required to accommodate regional jet services (up to CSeries)operating sectors as far as Perthd. The level of investment required to accommodate single‐aisle mainline jet services(737/A320) to sectors as far as PerthPAC recommends that KIC engage professional infrastructure cost assessors to identify the likelyfinancial requirements, and looks forward to providing these advisors with PAC’s work to date.7 As the largest turboprop aircraft in production, and a competitor aircraft to Virgin Australia’s ATR aircraft, it isprudent for KIC to consider a Q400 as the target aircraft for infrastructure planning.Page| 9
PRELIMINARY ASSESSMENT<strong>Kangaroo</strong> <strong>Island</strong> Air Passenger DemandNeither Pacific Aviation Consulting Pty Limited, nor its directors, employees, contractors nor agents guaranteethe accuracy, adequacy or completeness of any information contained within this report, and they are notresponsible for any errors or omissions or for the results obtained from the use of this information.This report does not constitute any form of advice that can or should be relied upon and Pacific AviationConsulting Pty Limited hereby disclaims any and all liability and responsibility in respect of anything, and of theconsequences of anything, done or omitted to be done by any person using and/or relying on the content ofthis report, wholly or partially, whether or not this is caused by any negligent act or omission. Any person usingthe contents of this report should obtain independent professional advice (legal, accounting, tax and business)and make their own enquiries as to the suitability of the content of this report.Level 57, MLC Centre19 Martin PlaceSydney NSW 2000 | Australiat: +61 (2) 9238 6163e: info@pacav.aerow: www.pacav.aeroClear insights, soaring results.Page| 10
PRELIMINARY ASSESSMENT<strong>Kangaroo</strong> <strong>Island</strong> Air Passenger DemandAppendix1. Model StructureThe <strong>Kangaroo</strong> <strong>Island</strong> Air Passenger Demand Model has been based upon statistics provided to PACby KIC & SATC. PAC has used these historical data, and built air passenger demand forecasts usinggrowth and share assumptions driven by other airports’ experience. PAC has assumed visitor and airpassenger growth under a variety of scenarios, using a ‘low‐medium‐high’ scenario set (as outlinedin the body of this Overview). From these forecasts, PAC has assessed the likely demand for airservices based on aircraft currently and likely to be in operation, both under monopoly operator aswell as competitive entry scenarios.The critical assessments in this Overview have been based on a ‘medium‐medium’ case, using thefollowing assumptions:Overall visitor growth: 2.9% per year, 2012‐2030Air passenger share of visitor demand: Rising from 12% to 30% of visitor movements by 2030Break‐even load factor for carriers serving <strong>Kangaroo</strong> <strong>Island</strong>: 70%Assumed primary aircraft: Saab 340 (Rex)Assumed competitor/new entry aircraft: ATR72 (Virgin Australia).Page| 11
PRELIMINARY ASSESSMENT<strong>Kangaroo</strong> <strong>Island</strong> Air Passenger Demand2. Modelling Summary – Flight Forecasts, No Competition3. Modelling Summary – Flight Forecasts, Competitive EntryPage| 12
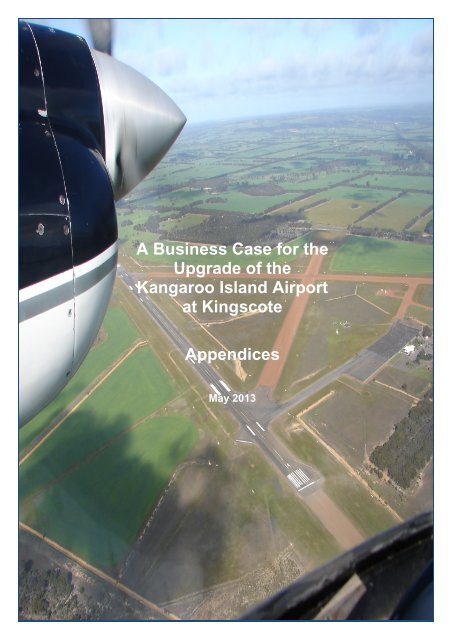
<strong>Kangaroo</strong> <strong>Island</strong> <strong>Airport</strong> Upgrade <strong>Business</strong> <strong>Case</strong> - <strong>Appendices</strong>BAppendix - Tonkin Consulting ReportMay 2013
<strong>Kingscote</strong> <strong>Airport</strong>Infrastructure Study Report<strong>Kangaroo</strong> <strong>Island</strong> CouncilOctober 2012Ref No. 20120935DR1A
Document History and StatusRev Description Author Reviewed Approved DateA Draft for comment BEM / TG RE RE 31 Oct 2012© Tonkin Consulting 2012This document is, and shall remain, the property of Tonkin Consulting. The document may only be used for the purposes for which it was commissionedand in accordance with the Terms of Engagement for the commission. Unauthorised use of this document in any form whatsoever is prohibited.Ref No. 20120935DR1A<strong>Kingscote</strong> <strong>Airport</strong> Infrastructure Study Report
Contents1 Introduction 11.1 Scope of Report 11.2 Purpose of Report 11.3 Study Brief 11.4 Study Methodology 12 Background and Context 22.1 The Present 22.2 The Future 23 Future Development Scenarios 33.1 Scenario Outlines 33.2 Design Aircraft 33.2.1 Scenario 1 33.2.2 Scenario 2 33.2.3 Scenario 3 43.2.4 Scenario 4 44 Site Investigations 54.1 Outline 54.2 Existing Drainage Culverts Beneath Runway 01/19 54.3 Assessment of Culverts for Future Development Scenarios 75 Airside Facilities 85.1 Preamble 85.2 Runway 01 / 19 Dimension Requirements 85.2.1 Existing 85.2.2 Scenario 2 – Bombardier Q400 85.2.3 Scenario 3 – Fokker F100 85.2.4 Scenario 4 – B 737-800 95.2.5 Practical Limitation on Runway Length 105.3 Noise Associated with Code 4 Aircraft 105.4 Taxiway A 115.5 Apron 115.6 Indicative Design – Pavement & Seal 115.6.1 Existing Pavement Design 115.6.2 Design Basis 125.6.3 Indicative Pavement Thickness and Surfacing Treatments 125.7 Operational Considerations 145.8 Navigational Aids and Lighting 145.9 Refuelling Facilities 14Ref No. 20120935DR1A<strong>Kingscote</strong> <strong>Airport</strong> Infrastructure Study Report
6 Terminal Building 166.1 Description of Existing Building 166.2 Need for Passenger and Baggage Screening 166.3 Building Spatial Requirements for Future Development Scenarios 166.4 Building Floor Layout Proposals 176.4.1 Scenario 1 176.4.2 Scenario 2 176.4.3 Scenario 3 186.4.4 Scenario 4 187 Landside Facilities 197.1 Car Parking 197.1.1 Description of Existing Facilities 197.1.2 Future Car Parking Requirements 197.1.3 Parking for Eco-Tour Vehicles 207.1.4 Additional Car Parking Proposals 217.2 Infrastructure Services 217.2.1 Electricity 217.2.2 Water Supply 217.2.3 Liquid Waste Disposal 217.2.4 Communications 228 Capital Costs Estimates 238.1 Introduction 238.2 Methodology 238.2.1 Development Scenario 1 238.2.2 Development Scenarios 2 – 4 238.3 Summary of Costs for Each Development Scenario 238.3.1 Basis for Capital Cost Estimates 248.3.2 Scenario Cost Comparisons 248.4 Annual Costs 258.4.1 Maintenance Costs 258.4.2 Depreciation Costs 268.4.3 Security Screening Costs 278.4.4 Annual Costs Summary 278.5 Anticipated Cash Flow 278.6 Local Expenditure Proportion 27TablesTable 5-1 New Pavement Thicknesses 13Table 8-1 Capital Cost Summary for Scenarios 2, 3 and 4 23Table 8-2 Pavement Element Comparison (All prices exclusive of GST, contingencies, etc.) 25Table 8-3 Summary of Maintenance Costs 25Table 8-4 Annual Depreciation Values 26Table 8-5 Total Annual Costs 27Table 8-6 Summary of Spending Breakdown 28Ref No. 20120935DR1A<strong>Kingscote</strong> <strong>Airport</strong> Infrastructure Study Report
FiguresFigure 4-1 1350 pipe excavation and location 6Figure 4-2 Diameter 1200 pipe excavation and location 6<strong>Appendices</strong>Appendix A <strong>Kingscote</strong> <strong>Airport</strong> – Current InfrastructureAppendix B <strong>Kingscote</strong> <strong>Airport</strong>Appendix C CalculationsAppendix D Capital Cost EstimatesRef No. 20120935DR1A<strong>Kingscote</strong> <strong>Airport</strong> Infrastructure Study Report
1 Introduction1.1 Scope of ReportThis document is a report on the engineering investigations that have been undertaken into theinfrastructure requirements and associated estimated capital costs to upgrade <strong>Kingscote</strong> <strong>Airport</strong>for four (4) separate future development scenarios. This airport is the only point of entry to<strong>Kangaroo</strong> <strong>Island</strong> for regular passenger transport (RPT) aerial services.The work was undertaken on behalf of the <strong>Kangaroo</strong> <strong>Island</strong> Council, the owner and operator ofthe <strong>Kingscote</strong> <strong>Airport</strong>. The Study brief was jointly developed by Pacific Aviation Corporation andthe Council.1.2 Purpose of ReportThe State Government (via the <strong>Kangaroo</strong> <strong>Island</strong> Futures Authority) is undertaking a series ofwide ranging reviews to determine appropriate strategies for the future development of the<strong>Island</strong>. The potential for increased visitation, particularly by overseas and interstate tourists, hasbeen recognised as a major component of future local economic activity.<strong>Kingscote</strong> <strong>Airport</strong> is one of only two major points of entry onto <strong>Kangaroo</strong> <strong>Island</strong>, the other beingferry services. The efficiency of air services is crucial for future development of and growth invisitation to the <strong>Island</strong>.Outputs from this Study (i.e. capital and ongoing cost estimates for the various futuredevelopment strategies) will be input to a number of cost benefit analyses and other broadranging policy development processes with a view to determine the most appropriate strategy forfuture economic development on <strong>Kangaroo</strong> <strong>Island</strong>, the most efficient aerial transport service forits community and the tourism traffic, and the appropriate level of development of <strong>Kingscote</strong><strong>Airport</strong>.1.3 Study BriefThe project brief was outlined in Tonkin Consulting’s letters dated 31 August 2012, and amendedby further letter dated 11 September 2012 and e-mail dated 17 September 2012. However, theexact requirements of the <strong>Kangaroo</strong> <strong>Island</strong> Council have been further determined throughongoing discussion, and through receipt of advice of the requirements of third parties (e.g.Pacific Aviation Corporation, Econsearch, etc.). Accordingly, scope management has remaineda key issue throughout the course of the project investigations.1.4 Study MethodologyThe four future development scenarios considered in this Study are detailed in Section 3.1hereunder. Scenario 1 was simply to maintain the status quo at <strong>Kingscote</strong> <strong>Airport</strong>. As TonkinConsulting developed <strong>Kangaroo</strong> <strong>Island</strong> Council’s asset management plan for this airport, themethodology for this scenario was simply to draw upon the costs estimates developed in thatpast work, updating where necessary.Scenarios 2, 3 and 4 involved upgrading the airport to cater for larger aircraft. The methodologyadopted for these future development scenarios was to undertake preliminary geometric designwork and indicative pavement design for the required airside extensions, determine terminalbuilding spatial requirements at the element level, and then finally derive estimates of capitalcost.Ref No. 20120935DR1A <strong>Kingscote</strong> <strong>Airport</strong> Infrastructure Study Report 1
2 Background and Context2.1 The PresentThe vast majority of visitors to and from <strong>Kangaroo</strong> <strong>Island</strong> must do so via one of only publiclyavailable means, namely: Via <strong>Kingscote</strong> <strong>Airport</strong>, the only place on the island serviced by RPT air services. All arrivalsat this airport emanate from Adelaide <strong>Airport</strong>, and similarly all departures from <strong>Kingscote</strong>are destined for Adelaide. Via Sealink Ferry, which operates between Cape Jervis on the South Australian mainlandapproximately 100km south of Adelaide and the port of Penneshaw approximately 60kmeast of <strong>Kingscote</strong> by road.Whilst overall visitor numbers to <strong>Kangaroo</strong> <strong>Island</strong> have enjoyed an upward trend over the lastdecade, total passenger numbers through <strong>Kingscote</strong> <strong>Airport</strong> have fallen slightly over the sameperiod. Various reasons have been put forward for this declining share of the air traffic mode.These include, but are not limited to: Lack of convenience – particularly for overseas visitors – in having to transit throughAdelaide <strong>Airport</strong>. Current marketing advantage enjoyed by Sealink, in that they can arrange, upon initialenquiry - and in addition to ferry booking - appropriate “packages” for visitors includingaccommodation on <strong>Kangaroo</strong> <strong>Island</strong>, and land transport - both on the <strong>Island</strong> and betweenAdelaide and Cape Jervis. The operator of aerial RPT services to <strong>Kingscote</strong> from Adelaidedoes not offer such broadening of its usual operational scope.At present, the RPT service to and from <strong>Kingscote</strong> is via Saab 340 aircraft – 34 seater turbo-propplane.2.2 The FutureThe South Australian Government has recognised the significance of <strong>Kangaroo</strong> <strong>Island</strong> as adestination for international and interstate visitors, and is of the belief that there is great potentialfor increased visitation. Various studies are underway into those factors that could limit futurevisitation to the <strong>Island</strong>. <strong>Kingscote</strong> <strong>Airport</strong> has been identified as a key area for future study.Essential prerequisites for the success of those strategies aimed at driving up visitation to the<strong>Island</strong> would be appropriate facilities and efficient and convenient air services to <strong>Kingscote</strong><strong>Airport</strong>. The latter point (efficient air services) applies particularly, although not exclusively, foroverseas visitors. <strong>Kingscote</strong> <strong>Airport</strong> in the future would need to be the destination for flightsemanating from, and origin point for flights to, other Australian cities such as Melbourne andSydney.Aviation economics will dictate that the possible future longer haul flights operating to and from<strong>Kingscote</strong> will be by larger aircraft (70 seat turbo-prop aircraft, regional jets or single aislemainline jets). To meet possible future needs, a full review of airside facilities, terminal building,third party services and landside infrastructure at <strong>Kingscote</strong> is necessary.This Report outlines those initial reviews, as undertaken for this Study. Infrastructurerequirements for four different future development scenarios have been determined, andindicative capital cost estimates associated with each have been prepared. These have beenpresented in Section 8 below.The details of the four scenarios considered are listed in Section 3.1 below.Ref No. 20120935DR1A <strong>Kingscote</strong> <strong>Airport</strong> Infrastructure Study Report 2
3 Future Development Scenarios3.1 Scenario OutlinesThe Study Brief required that the airport infrastructure requirements for four (4) futuredevelopment scenarios be examined. These scenarios were as outlined below: Scenario 1The level of investment required to maintain <strong>Kingscote</strong> <strong>Airport</strong> on an as-is basis assumingcontinued use of Saab 340 aircraft for RPT services, with occasional use by larger aircraftwith individual permits. Scenario 2The level of investment required to accommodate ATR72 & Q400 aircraft operating sectors(at full passenger and cargo payload) as far as Melbourne. Scenario 3The level of investment required to accommodate regional jet services (up to Code 3C)operating sectors as far as Perth. Scenario 43.2 Design AircraftThe level of investment required to accommodate single-aisle mainline jet services (B737 /A320) to sectors as far as Perth.For the purposes of this Study, a “design aircraft” has been selected for each scenario. Thefollowing sub-sections outline the reasons for the selection of the options considered for eachscenario.3.2.1 Scenario 1<strong>Kingscote</strong> airport was designed for Fokker F27 turbo prop aircraft (approximately 50 seats andgross weight of 20.8 tonnes). However, the only RPT operator now servicing <strong>Kingscote</strong> hasused only the smaller Saab 340 turbo prop aircraft (34 – 36 passengers and gross weight 13.2tonnes).Selection of a design aircraft for this scenario requires some level of speculation regarding futureoperators. The smaller class of turbo-prop aircraft are no longer being manufactured to historicallevels. The F27 (20.8 tonnes) is essentially obsolete, and production of the newer Fokker F50(58 seats and 20.8 tonnes) ceased in 1996. Production of the Saab 340 has also ceased, in1999. The last Bombardier Dash 8 300 (56 seats and 18.9 tonnes) was manufactured in 2008.It is difficult to determine the type of aircraft that will provide RPT services between Adelaide and<strong>Kingscote</strong> when the present Rex Airlines Saab 340 aircraft reach the end of their service life.Perhaps this duty would be taken up by smaller (18 passengers) twin-engine commuter aircraft.Suffice to say the existing airport infrastructure and facilities would be well placed toaccommodate such aircraft, assuming that maintenance of the asset continues.Given this uncertainty, the conservative selection of the Saab 340 has been made as the “designaircraft” for this scenario.3.2.2 Scenario 2The ATR72 (62 – 74 seats and 23 tonnes) and Bombardier Q400, otherwise known as the Dash8 400 (68 – 78 seats and 29.3 tonnes) are the most common of these larger turbo prop typeaircraft operating in Australia with the range to operate between <strong>Kingscote</strong> and MelbourneRef No. 20120935DR1A <strong>Kingscote</strong> <strong>Airport</strong> Infrastructure Study Report 3
It is reasonable that the latter aircraft (the larger) be adopted to provide an element ofconservatism for pavement and terminal building design for this future development scenario.Federal Government requirements for passenger and baggage screening will be invoked byeither of these aircraft (required for aircraft with maximum weight in excess of 20 tonnes). Referto Section 6.2 herein.3.2.3 Scenario 3Regional jet aircraft (Code 3C) operating in Australia would include the Embraer EMB 170 (70 -78 seats and 36tonnes) and the Fokker F 100/70 (107 seats and 41.7 tonnes). Such aircraft arecapable of non-stop operation between <strong>Kingscote</strong> and Perth.A check of the Australian aircraft register lists only three (3) EMB 170 aircraft in operation atpresent. Hence, the chances of that aircraft operating out of <strong>Kingscote</strong> are extremely remote.Alternatively, there are approximately forty-two (42) F100/70 aircraft registered in Australia (toSkywest and Alliance Airlines). Accordingly, this would appear to be the only realistic choice fora regional jet at the present time for this development scenario.3.2.4 Scenario 4Single-isle mainline jet services in Australia are predominantly provided by Boeing 737 800 (162– 175 seats and 79.25 tonnes) and Airbus 320 (148 – 180 seats and 77 tonnes) aircraft. Theseare very similar in terms of total weight and number of passengers able to be accommodated.The former has been adopted for this scenario, its slight additional weight providing someconservatism in design.Ref No. 20120935DR1A <strong>Kingscote</strong> <strong>Airport</strong> Infrastructure Study Report 4
4 Site Investigations4.1 OutlineA site investigation was undertaken on Monday October 8, 2012. The purpose of thisinvestigation was to familiarise Tonkin Consulting with the existing site infrastructure and betterunderstand its limitations and potential requirements for upgrade. In particular, a number ofexisting drainage culverts beneath runway 01 / 19 were investigated to assist in structuralassessments.4.2 Existing Drainage Culverts Beneath Runway 01/19Existing design drawings show two buried drainage culverts beneath the existing Runway 01 /19; a 1350mm diameter class ‘X’ reinforced concrete pipe (1350 RCP) located at the junction ofrunway 15 / 33; and a 1200mm diameter class ‘X’ reinforced concrete pipe (1200 RCP) locatedat approximately the midway point of runway 01 / 19. The locations of these can be seen in the<strong>Airport</strong> Layout Plan in Appendix A.The location of the 1350mm diameter pipe is at the intersection of Runways 01 / 19 and 15 / 33,and is in the touchdown zone for aircraft landing on Runway 01 / 19 from the south. Accordingly,this pipe in particular could be subject to subject to impact loading additional to that due to wheelloadings by themselves.The condition of the pipes has been included in periodical condition assessments of the existingairport facilities, and they are currently deemed to be in good condition.The pipes were assessed to provide confidence that under the increased loadings of the designaircrafts the pipes would not be damaged. The major concern is that if the pipe were to sufferstructural damage then there would be a risk of collapse of the runway above the pipe.In order to undertake structural assessment of these pipes it was necessary to excavate andconfirm the cover of the pipe and the materials and quality of the backfill through visualinspection. A backhoe was used to excavate a test pit above each pipe approximately 1.0 metrefrom the edge of the runway seal. Photographs of the test pits and their locations can be seen inFigure 4-1 and Figure 4-2 on the following page. Both excavations were located on the upstreamside of the runway to ensure that the minimum cover from top of pipe to the surface wasestablished.The excavation works confirmed the cover to top of each pipe was 800mm at the location of thetest pit. The backfill was confirmed to be very well compacted sand to approximately 400mmabove the top of pipe with the remainder of the backfill consisting of a well compacted gravel andsand mixture to the surface.The cover quoted above is the minimum cover under the runway for each culvert. Allowing forcross-fall in the runway pavement and longitudinal fall in the pipes themselves, the cover wouldincrease to slightly above a metre at the runway centre-line, and would be well in excess of800mm for the majority of their length beneath the runway. Adoption of this minimum figure forpipe cover in the structural assessment work has therefore provided an element of conservatismin the calculation of live loads.In addition to the aforementioned pipes a number of other pieces of drainage infrastructure wereidentified. A 600mm concrete pipe crosses beneath taxiway ‘A’ between runway 01 / 19 and theterminal apron. Another concrete pipe estimated to be 675mm in diameter runs adjacent to theterminal and has a number of grated inlet pits used to pick up surface water from the apron.Design drawings show that these pipes have only 500 – 600mm of cover.Ref No. 20120935DR1A <strong>Kingscote</strong> <strong>Airport</strong> Infrastructure Study Report 5
5 Airside Facilities5.1 PreambleThis section deals with all airside facilities requirements for future development scenarios 2, 3 &4. Matters addressed include extensions to Runway 01 / 19, Taxiway A and the Apron geometry;pavement and seal design; and navigational aids.The current RPT aircraft servicing <strong>Kingscote</strong> airport do not re-fuel at <strong>Kingscote</strong>. Future refuellingfacilities for RPT aircraft has also been discussed.Two factors may limit the maximum length of Runway 01 / 19 that can actually be constructed.These are aircraft noise and vegetation clearance. These factors have also been discussed indetail, although these possible practical limits have been ignored in the assessment ofinfrastructure requirements and capital cost estimation for each of the above future developmentscenarios.5.2 Runway 01 / 19 Dimension Requirements5.2.1 ExistingThe existing runway is sealed, 1402m long by 30 wide and in a 1693m long x 150m wide gradedrunway strip. The existing clearways at the northern and southern ends are 183m and 108mrespectively.The layout plan for <strong>Kingscote</strong> <strong>Airport</strong> is presented in Appendix A hereto. This runway, Taxiway Aand the Apron were all designed for Fokker F27 aircraft and a 15 year pavement life. Currentaircraft providing RPT services to <strong>Kingscote</strong> are smaller and hence Scenario 1 (maintenance ofthe status quo) requires no upgrading or capital injection. However, re-surfacing andmaintenance in accordance with Council’s Asset Management Plan will be required.5.2.2 Scenario 2 – Bombardier Q400Formal advice received from Qantaslink states for direct flights to Sydney or Melbourne a runwaylength of 1550m with 60m clearways and obstacle clear gradient of 1.9% would suffice. Thisimplies a 148m extension of the runway, and this Study assumes that this would take place atboth ends. The required width of the runway would be 30 metres. A 150m wide graded runwaystrip will still apply.Figure 2 in Appendix B depicts the airside facilities required for this scenario.5.2.3 Scenario 3 – Fokker F100Advice is still awaited from Alliance Airlines on the runway length requirements for flights ex<strong>Kingscote</strong> to Melbourne, Sydney and Perth. However, previous advice from that company inrelation to possible direct flights from Prominent Hill to Melbourne (a route of 1260km) provides areasonable basis for this Study as set out below. In that previous case, the formal advice givenwas that a 2100m runway with an additional 100m of stop way would be required.By way of comparison, <strong>Kingscote</strong> to Melbourne is 700km and <strong>Kingscote</strong> to Sydney is 1252km(very similar to the 1260km above). The length required at <strong>Kingscote</strong> would be less thanProminent Hill due to reduced ambient temperature. Bureau of Meteorology data below showsthe highest average maximum for January is 40.2 at Coober Pedy (100km north of ProminentHill) compared to 28.9 at <strong>Kingscote</strong>. The data for Coober Pedy and <strong>Kingscote</strong> are presented inthe tables below. (No historical records are available for Prominent Hill).Ref No. 20120935DR1A <strong>Kingscote</strong> <strong>Airport</strong> Infrastructure Study Report 8
Coober Pedy<strong>Kingscote</strong>Accordingly, a runway length of 2100m has been adopted for the purposes of this Study. This isbelieved to be conservative for flights ex <strong>Kingscote</strong> to Sydney, although it may be slightlydeficient for flights to Perth. However, there are significant external approvals to be obtained infuture to enable such an extension to be implemented. Refer to the vegetation clearance matterraised in Section 5.2.5 below.Such runway length implies a 698m extension over the existing sealed runway length, whichwould be mainly to the south but include the maximum practical extension to the north. It wouldalso require land acquisition by Council south of the airport. Finally, vegetation clearance ortrimming will be required on privately owned land to the south of the airport.A runway width of 30m is still acceptable for these Code 3C aircraft, although 3m widecompacted and erosion resistant gravel shoulders will also be required. Again, 60m longclearways have been assumed for each end. A 150m wide graded runway strip will still apply.Figure 3 in Appendix B depicts the airside facilities required for this scenario.5.2.4 Scenario 4 – B 737-800Formal advice from operators of A737 800 aircraft as to requirements for flights ex <strong>Kingscote</strong> toPerth has not been received at time of writing. Nevertheless, a reasonable precedent existswhich can be used as a basis to progress the Study.Prior to the extension of the Adelaide airport runway (to 3100m) in 1998, flights direct to Perthpreviously operated off the then 2500m long runway. These flights to Perth were weight-limitedonly on very hot days. As <strong>Kingscote</strong>’s maximum temperatures are below Adelaide’s, a runwaylength of the order of 2500m should be adequate for flights as far as Perth.This runway length represents a 1098m extension over the existing sealed runway length, thevast majority of which would be to the south but include the maximum practical extension to thenorth. Significant land acquisition would be required to the south of the airport. A large amountof vegetation clearance would be required and there may be difficulty securing the necessaryapprovals for same. (Refer to Section 5.2.5 below). There would also be significant noisenuisance to the south of the airport. (Refer to Section 5.3 below).B 737 800 and A 320 single-isle mainline jets are classed as Code 4 aircraft. Accordingly, a 45mwide runway would be required. 60m long clearways at each end have also been adopted.Figure 4 in Appendix B depicts the airside facilities required for this scenario.Whilst capital cost estimates have been prepared for this 2500m long runway option, it is by nomeans certain that the necessary approvals could ever be secured for this development scenario(i.e. B737 flights as far as Perth). The issues are discussed in Sections 5.2.5 and 5.3 below.Ref No. 20120935DR1A <strong>Kingscote</strong> <strong>Airport</strong> Infrastructure Study Report 9
5.2.5 Practical Limitation on Runway LengthRunway length available if maximising use of existing runway stripThe maximum length of runway that could be constructed within the existing runway strip oflength 1693m whilst allowing for a 60m minimum required clearway at each end is 1573m. Thisis sufficient for Scenario 2 only.Runway Length Available Within Existing Aerodrome BoundaryExtension of the runway strip to the north is constrained by Arranmore Road being locatedapproximately 102m north of the existing clearway end. Allowing for a future 2.1m high securityfence on the road reserve road boundary would result in a future obstacle gradient of 2.1% fromthe current end of clearway. The desirable maximum gradient is 2%In addition any further extension to the north will run into obstacle clearance issues, in particulartall Eucalypt trees growing along the Cygnet River. Approval to remove or trim these trees islikely to be difficult to obtain.At the southern end, the existing boundary is approximately 328m south of the southern end ofrunway strip of Runway 01. (Note that a drain is located 158m south of the existing runway, andthat a new pipe will be required beneath any runway extension across it). Allowing 100mclearance from a future security fence, the maximum extension would be 228m (that is equal to328m - 100m).Accordingly, the maximum available runway length within the existing aerodrome boundarywould be 1801m (= 1573m derived above + 228m). This is insufficient for both Scenarios 3 and4.Maximum Runway Length Assuming Property AcquisitionA further extension would be limited to the south only, assuming that Arranmore Road wouldneed to remain in place. Significant trees along the Cygnet River are also likely to prove to be aconstraint to development in that direction.An extension to the south is potentially limited by: Low area and dwellings 1740m from the existing runway end Noise on residences and bowling club Obstacle clearance issues due to many large trees.The noise issue is discussed in more detail in Section 5.3 below.Survey data shows a range of large trees in the vicinity of the above houses. These extend inheight to 24.73m above the existing clearway. Extending the runway 600m to the south to a totallength of 2000m would increases the gradient over the trees to 2.19%.Extending the runway to 2500m total length greatly increases the amount of clearing that wouldneed to be undertaken to provide an appropriate approach gradient. The likely problems insecuring the necessary approvals for clearing large numbers of trees tends to suggest thepractical runway limit is of the order of 2000m, and that Scenario 4 is unlikely to be a viableoption.5.3 Noise Associated with Code 4 AircraftThere are a number of dwellings located 3150m - 3300 from the start of takeoff Runway 19.AS 2021 Acoustics—Aircraft Noise Intrusion—Building Siting and Construction shows a potentialnoise level at the dwellings of 88 dB(A) for B737 / A320 taking off to the south from a 2500m longrunway.Ref No. 20120935DR1A <strong>Kingscote</strong> <strong>Airport</strong> Infrastructure Study Report 10
For aircraft landing to the north and assuming the runway length is 2500m, the distance from theresidences to the threshold would only be 800m. The potential noise from a B737 / A320 onlanding at the location of residences is 97 dB(A).On the other hand, for a 2000m runway length the peak noise on the extended runway centrelinereduces to 92 dB(A) in the vicinity of the above dwellings.This would suggest that, in the case of B737 and A 320 jets (i.e. Scenario 4), noise is a potentialissue and a runway length greater than 2000m may not be viable.5.4 Taxiway A5.5 ApronThe existing width of Taxiway A is 15m. The required taxiway width is 18m for Code 3C aircraftexcept that this can be reduced to 15m in the case of aircraft with a wheel base of less than 18m.This applies equally to F100 and Q400 (Scenarios 2 and 3). Note Q400 is listed as Code 3D butCASA have granted a national exemption for the aircraft to be considered as Code 3C.However for Scenario 3, it will be necessary for 3m wide compacted and erosion resistantshoulders to be provided. For Scenario 4, the Taxiway A seal will need to be increased in widthto 18m.Fillets from Runway 01 / 19 are adequate for larger aircraft.The existing Apron can adequately cater for the aircraft parking needs for development scenarios1 and 2.In determining the apron width for Scenario 3 it has been assumed that it will be necessary tosimultaneously and independently park 1 x F100, 1 x F50 or Q400 and 1 x PC12 aircraft. It hasalso been assumed that it will be necessary to design to ensure passenger protection from jetblast by providing appropriate clearances to limit exposure to 60kph maximum.The outer (southern) edge of the Apron is considered by CASA as taxiway as it allows aircraft totraverse from one part of the aerodrome to another part. The taxiway strip width for Code C is26.5m from centreline.The minimum width of this combined taxiway / apron is required to allow for ½ taxiway width +taxiway strip width from centreline + aircraft wingspan + object clearance + walkway width. Thisequates to 9m + 26.5m + 28m + 4.5m +3m = 71m.The width of the existing Apron from the fence to the outer southern edge is generally 68mdecreasing to a minimum width of 63m towards the eastern end. Consequently, widening forScenario 3 is required. In addition the western end of Taxiway A would need to be realignedslightly to line up with the new southern edge of the apron.For Scenario 4, the required width of the apron would be even greater – by the increasedwingspan of B 737 800 aircraft over the F100, that is, a further 12m. Consequently, an apronwidth of 85m has been adopted.5.6 Indicative Design – Pavement & Seal5.6.1 Existing Pavement DesignThe design structure for the existing runway and taxiway pavements comprised: Surface Base2 coat 10/7 bituminous spray seal.100 - 150mm (min. thickness) blended crushed basalt and natural limestonegravel compacted to 98%MMDD. Sub-base 150 - 200mm natural limestone gravel CBR 35.Ref No. 20120935DR1A <strong>Kingscote</strong> <strong>Airport</strong> Infrastructure Study Report 11
Selected fill Sub-grade220mm sand CBR 10 compacted to 96% MMDD.clay nominal CBR 6 compacted to a depth of 150mm to 95% MMDDThe original pavement design aircraft was the Fokker F27 with an all up weight of 20,000kg at atyre pressure of 550kPa and a 15 year life design life.5.6.2 Design BasisNormally at the end of the design life, it is not expected that an existing pavement would requirereplacement or even tyning up and re-compacting. Certainly, there is no evidence that suchradical treatment would be required anywhere on the <strong>Kingscote</strong> Runway 01 / 19. Accordingly, forthe design of overlays for upgraded pavements a minimum CBR of 35 has been adopted for theexisting sub-base pavement material (that is the material 150mm to 300mm below the existingsurface level.Similarly, for areas of new pavement, it has been assumed that the pavement structure willcomprise a selected fill layer of CBR 10 sand, a sub-base of CBR 35 pit rubble and a basecourse (assumed soaked CBR of 60-80).The following lists details the possible design aircraft and the required pavement thickness forthe various CBRs in the existing pavement structure.AircraftMax WeightkgTyrePressureKPaPavementthicknessmm on CBR 6Pavementthicknessmm on CBR10Pavementthicknessmm on CBR35ACN (6)BAe 146 2 40,600 880 593 436 175 24B737 800 79,243 1413 797 568 270 51Dash 8 400 29,347 972 510 370 160 18EMB 190 50,460 1014 640 470 203 30Fokker F27 F50 20,412 580 433 310 116 12Fokker F100 44,680 980 655 483 196 30NOTESPavement comprises subgrade CBR 6, sub-base CBR 10 and base CBR 35Design thickness based on 1200 annual departuresCOMFAA assumes BC surface layer (not used in Australia other than heavy jet pavements)For heavy aircraft 75mm BC surface layer at 1.5 equivalency, 38mm added to COMFAA result5.6.3 Indicative Pavement Thickness and Surfacing TreatmentsNew PavementsBased on the above requirements, the adopted design for new pavements (i.e. runwaylengthening and widening) for the future airport development scenarios are as set out in Table5-1:Ref No. 20120935DR1A <strong>Kingscote</strong> <strong>Airport</strong> Infrastructure Study Report 12
Table 5-1New Pavement ThicknessesPavement Course Thicknesses (mm)Development Scenario 2 3 4Design Aircraft Bombardier Q400 Fokker F100 B 737-800Select Fill (CBR 10) 150mm 180mm 230mmSub-base (CBR 35) 220mm 330mm 270mmBase 150mm 150mm 300mmTotal 520mm 660mm 800mmOverlay SectionAgain based on the above requirements, the adopted design of the overlay thickness for thoseexisting pavement areas in need of strengthening under the future development scenarios is asfollows:Scenario 2:Scenario 3:Scenario 4:Nil requirement (because the existing base appears sound and there isadequate thickness over the existing CBR 35 sub-base material).150mm300mmNote that these thicknesses are the same as the base course thicknesses for the respectivedevelopment scenario – a decision made in the interests of construction convenience.It has also been assumed that existing pavements to be overlaid would have the existing bitumensurfacing removed or pulverised and mixed into the base material immediately prior to theplacement of the overlay course.In relation to Scenario 2, where no overlay is proposed over the existing pavements, it isassumed (and recommended) a program of close monitoring will be implemented to assess theperformance of the existing pavement sections once the Q400 aircraft commence operations.Surfacing ProposalsIt is envisaged that a multi-coat bituminous spray seal (10mm / 7mm) would be provided forScenarios 2 and 3, but a final sand / emulsion coat would be required for the latter. This is acommon norm for airports of this standard in Australia.However, for Scenario 4, a 40mm thick asphaltic concrete surfacing layer with maximumaggregate size of 14mm has been assumed. There are a few examples in Australia of wheremainline jet aircraft have operated from spray sealed runways, but such instances are rare andare usually only a short term situation.Scenarios 3 and 4 will both require a sealed surface extending beyond each runway end for atleast 15m as blast protection.Ref No. 20120935DR1A <strong>Kingscote</strong> <strong>Airport</strong> Infrastructure Study Report 13
Taxiway A and ApronPavement and surfacing requirements for these areas for each Scenario 2, 3 and 4 will be thesame as that proposed for Runway 01 / 19 in the respective scenario.Grooving – AC SurfacesFor the AC surfacing adopted for the Scenario 4 design, it is also assumed that grooving will berequired on Runway 01 / 19 to ensure adequate skid resistance for the safe operation of B 737aircraft.5.7 Operational ConsiderationsThe following operational considerations have been assumed for all airport developmentscenarios: Runway End Safety Area 90m x 60m wide at each end of runway strip Approach surface 150m inner edge 15% splays cleared to below 2% to NPA Take off surface 180m inner edge 12.5% splays, cleared to below 2% Transitions 1 in 7 clearance from 150m runway strip edge clear to height 45m.5.8 Navigational Aids and LightingIt is assumed that for Scenarios 2, 3 and 4, Runway 01 / 19 would be required to cater for noninstrumentapproach by Code 3C and Code 4 aircraft.However, there are existing NDB and GPS systems already available for instrument approachoperation.The airport is equipped with wind direction indicators. The existing illuminated wind directionindicator (IWDI) will be retained for all development scenarios. However, a new unlit windindicator will be required at the southern end of Runway 01 / 19 for each of Scenarios 2, 3 & 4,as that runway is extended further south.There is no formal requirement for slope guidance for Scenarios 1, 2 or 3, but given the use ofexisting A-TVASIS this would be retained. However, the facility at each end of Runway 01 / 19will need to be relocated for each of the Scenarios 2, 3 and 4 (because the position of therunway ends will be altered).Regrettably, this system is an obsolete one and spare parts are now becoming increasinglydifficult to procure. It is therefore proposed that for all scenarios the existing A-TVASIS systembe replaced with an A-PAPI system to design aircraft wheel clearance over threshold.Runway 01 / 19 is equipped with runway lights. Those on the sides are required to be installed atan even 60m spacing and hence the recent installation needs to be extended for Scenarios 2, 3and 4. In addition, the threshold lighting will need to be relocated to suit the new runway endlocations.5.9 Refuelling FacilitiesFuel is currently not available at <strong>Kingscote</strong> <strong>Airport</strong>. Presumably the existing RPT operator hasdetermined that it is more economical for its flights operating from Adelaide to rely on thefacilities there.However, for longer flights from <strong>Kingscote</strong> – such as those implied in future developmentScenarios 2, 3 and 4 – the economic imperatives are likely to change, and refuelling facilities arelikely to be required. Such facilities could be provided by the airport operator (<strong>Kangaroo</strong> <strong>Island</strong>Council), by the operator of the future longer range flights, or by a third party.Ref No. 20120935DR1A <strong>Kingscote</strong> <strong>Airport</strong> Infrastructure Study Report 14
In this Study, allowance has been made for the capital cost of establishing a fuel storage anddispensing facility, complete with impervious bunds to prevent accidental discharge to theenvironment. The assumption implicit in such allowance is that the facility would be owned byCouncil and located on airport land, which would avoid the need for sub-lease arrangements. Ithas also been assumed that Jet A1 fuel only (suitable for turbo-prop and light jet use) would beavailable from this facility - not all types of aircraft fuel.Without knowledge as to neither the demand patterns for aviation fuel, nor the frequency of resupply(assumed to be via B-double road tanker from Adelaide via the ferry) sizing the on-sitestorage facility must involve some conjecture. For the purposes of this study, it is assumed thata similar unit to that recently contemplated for the Prominent Hill airport would suffice at<strong>Kingscote</strong> <strong>Airport</strong>. This comprises: 55,000 Litre Jet A1 self contained, above-ground, horizontal storage tank. The tankconstruction consists of a steel outer tank wrapped around a steel inner tank with interstitialspace between the two tank faces. (This dual skin arrangement avoids the need forbunding). Jet A1 bridging receipt facility. Transfer pump, filter, water separator unit, and valves. Separate Jet A1 dispensing station comprising of filter monitors, flow meter, hose reel andaircraft loading hose/nozzle. Electrical switchboard. Quality control shed.The 36m maximum allowable flexible hose length means that only one aircraft park positioncould be serviced by this re-fuelling facility. If more than one aircraft required fuel, it would benecessary to shift aircraft around. Alternatively, it would be necessary to increase the investmentand provide some fixed, buried delivery reticulation piping to another aircraft parking area and asecond flexible hose. The Study makes no allowance for such additional investment.Finally, no allowance has been made in this Study for any operating cost or depreciation for thefacility. It is assumed that such ongoing costs would be balanced by any profit made in the saleof such fuel, resulting in a financially neutral situation.Ref No. 20120935DR1A <strong>Kingscote</strong> <strong>Airport</strong> Infrastructure Study Report 15
6 Terminal Building6.1 Description of Existing BuildingThe existing terminal building at <strong>Kingscote</strong> <strong>Airport</strong> is a single storey building approaching 30years in age. It has an internal floor area of approximately 330 square metres. Verandas on allsides of the core building do provide significant additional usable space.A drawing depicting the floor plan of this existing building is presented in Appendix A.The terminal building incorporates a single, common arrivals / departure lounge, with no meansof incorporating a secure, “sterile” area necessary if departing passengers and their handluggage are to be X-ray screened in future. Baggage handling facilities (both make-up andreclaim) do not comply with current practice. There are no checked-in baggage screeningfacilities.The structure contains only modest toilet facilities and offices for airline operators, car hirecompanies, etc. There is no café or even a kiosk facility.6.2 Need for Passenger and Baggage ScreeningCurrent federal legislation relating to security screening of RPT airline passengers and theirbaggage is based on the gross weight of the aircraft operating the service. At this stage securityscreening is required for passengers and their baggage if the gross weight of the RPT aircraft isin excess of 20 tonnes. These requirements came into effect from 1 July 2012.No exemptions have been granted to this requirement by the authority concerned.This means that, if there is any upgrading of service to <strong>Kingscote</strong> <strong>Airport</strong> along the lines of futuredevelopment scenarios 2, 3 and 4, passengers and their checked-in luggage will need toundergo security screening.This fact will be a primary driver for the expansion of the <strong>Kingscote</strong> airport terminal building.Clearly, there will be other drivers such as a need cater for increased passenger numbers as wellas the imperative to make the facility as contemporary as passengers would expect.6.3 Building Spatial Requirements for Future Development ScenariosAn estimate of the spatial requirements for the various components of a terminal building hasbeen prepared for each Scenario 2, 3 and 4. This has been based on commonly used designparameters within the industry. It allows for the design aircraft for a particular Scenario to be onthe ground simultaneously with a Saab 340 aircraft which provides the current service fromAdelaide, with passengers embarking on and disembarking from both planes in the samerelatively short time span. It also allows for the available seats on both planes to be 80%occupied on both arrival and departure.Other design parameters / assumptions include: Space adjacent to the check-in counters needs to cater for 40% of departing passengers at2 m 2 each, 50% of whom have an accompanying friend at 1.5m 2 each. An additional 10% of the gross area thus derived is allowed for circulation space. The baggage make-up area will require 2m 2 per departing passenger. The secured gate lounge will require 1.5m2 for each departing passenger, plus 1m2 for afriend for 30% of the departing passengers. An additional 20% of the gross area thus derived is allowed for circulation space. The baggage reclaim area will require 1.2m2 per arriving passenger, plus 1m2 for a friendfor 30% of the arriving passengers.Ref No. 20120935DR1A <strong>Kingscote</strong> <strong>Airport</strong> Infrastructure Study Report 16
An additional 20% of the gross area thus derived is allowed for circulation space. The arrivals hall will require 1.25m2 for each arriving passenger, plus 1m2 for 30% of eachof the arriving passengers.Clearly, spatial allowance also needs to be made for other facilities such as offices for the airportmanager, each air service operator and car hire companies; other concessions; café andalfresco; toilets; plant rooms; interview rooms, etc.This estimate of the spatial requirements is presented in Table 1 in Appendix C. The right handcolumn shows - for comparative purposes only – the intended spatial provisions being providedin the new Port Lincoln <strong>Airport</strong> terminal building. Discussion on this point is provided in Section6.4.4 hereunder.6.4 Building Floor Layout Proposals6.4.1 Scenario 1It has been assumed that for Scenario 1 the terminal will continue to function as it currently does.This implies that no cost, other than ongoing maintenance and incidental costs, will be requiredas part of this scenario.6.4.2 Scenario 2The design aircraft for this scenario, the Dash 8 400, can seat up to 78 passengers. The existingterminal caters for aircraft of capacity of 36 passengers. In addition, and as discussed in Section6.2, scenario 2 will require security screening of passengers and their luggage. To provide afacility that functions efficiently and effectively the terminal will be need to be significantlyexpanded.A proposed terminal layout can be seen in Figure 5 in Appendix B. This layout makes provisionfor an incoming (or outgoing) Dash 8 400 as well as an outgoing (or incoming) SAAB 340. Thisequates to a total of 114 passengers.This layout aims to retain as much of the existing terminal as possible to minimise costs. Thecurrent terminal is most predominantly constrained to the north, with car parking and majorservices infrastructure being located to the northern side of the terminal. To the south is theapron, and to the east is bus parking. With the expanded terminal it will be likely that bus parkingwill become increasingly important.A grassed reserve is located to the west of the terminal and is a logical space into which toexpand the terminal building. The space currently has a number of services which would requirerelocation. These include a fire hydrant and associated stop valve and fire hose reel, and twowater taps. These can be relatively easily relocated.It is proposed that the majority of the existing terminal will become the arrivals lounge. Theexisting hire vehicle desks, offices and toilets can all be maintained and their use can bemaintained. The Rex check-in desk will need to be relocated to the departure lounge to ensureefficiency. The existing check-in desk area can be for additional supplier desks and kiosk.External space adjacent to the kiosk could also be used as an outdoor eating area.The new area will comprise of a departure lounge and check-in area. An entry / exit door will beprovided for this area from the northern roadway. Adjacent to the check-in area is the passengerscreening, which will lead into the secure lounge with an associated air lock. A set of toilets willbe provided within the secure area to reduce the number of people entering and exiting this area.A baggage screening area is also provided. An area is provided outside the baggage screeningarea for loading onto a vehicle for the baggage to be transferred to the aircraft. This area willneed to be fenced and secured from the public space.A kiosk has been provided between the existing and new terminal areas.Ref No. 20120935DR1A <strong>Kingscote</strong> <strong>Airport</strong> Infrastructure Study Report 17
The floor space provided by this layout roughly equates to the estimated requirement shown forScenario 2 in Table 1 in Appendix C.The new terminal as detailed in Figure 5 in Appendix B will extend south and will require theexisting security fence delineating the apron to be shifted south by approximately 5.5 metres.6.4.3 Scenario 3The proposed terminal layout is very similar to the Scenario 2 layout discussed above but with anadditional area of 95m 2 in the arrivals hall and an additional 90m 2 under-roof baggage reclaimarea. The area between this extended arrivals hall area and the secure lounge could potentiallybe used as an extension to the kiosk.These “additions” to the Scenario 2 proposals are also depicted in Figure 5 in Appendix B.Similarly to scenario 2, the layout makes provision for an incoming (or outgoing) Fokker 100/70as well as an outgoing (or incoming) SAAB 340. This equates to a total of 143 passengers. Thedetails of the calculated space can be seen in Section 6.3.The new terminal will extend south as with scenario 2 and will require the existing security fencedelineating the apron to be shifted south by approximately 5.5 metres.6.4.4 Scenario 4The design aircraft for this scenario, the Boeing 737, can seat up to 170 passengers.The estimated spatial requirements for Scenario 4 as shown in Table 1 in Appendix C are veryclose to actual size of the new terminal building currently under construction at the Port Lincoln<strong>Airport</strong>. (Refer to the right hand column in that Table). The floor plan and elevations and theconstruction cost for that new building is set out for public consumption on the District Council ofLower Eyre Peninsula web site, along with the <strong>Business</strong> <strong>Case</strong> Report for that project.Accordingly, no attempt has been made in this Study to prepare a terminal building layout forScenario 4. The publicly available information would appear to be directly relevant to Scenario 4in this present Study.It is most likely that due to current site constraints to the north and west that the terminal willexpand to the west and to the south. This will require additional apron augmentation works aswell as relocating the existing helicopter pad and removal of the abandoned control tower.Fencing will also be required to be relocated.Figure 6 in Appendix B depicts the approximate dimensions of the Port Lincoln Building over thesite for the existing <strong>Kingscote</strong> <strong>Airport</strong> terminal building. This gives a comparison of the relativesizes of the existing building and the apparent terminal requirement for Scenario 4.However, because the existing building would need to continue to operate efficiently whilst thenew building was being constructed, a more practical siting would be clear of, and to the west of,the existing terminal building. Some protrusion onto the existing Apron area would be implied,and this fact has been reasonably accounted for in the Scenario 4 apron design and capital costestimate.Ref No. 20120935DR1A <strong>Kingscote</strong> <strong>Airport</strong> Infrastructure Study Report 18
7 Landside Facilities7.1 Car Parking7.1.1 Description of Existing FacilitiesThe existing car parking facility is located to the north of the terminal. Tonkin Consultingundertook a carpark layout design in 2010 for the <strong>Kingscote</strong> <strong>Airport</strong>. This layout is shown inAppendix A. It is understood that at the time of writing this report the majority of the upgradesassociated with this layout had been completed with the intention of completing the remainingupgrades in the near future.The public entrance is from Arranmore Road and the facility is split into three distinct areas. Themost eastern area is reserved for bus parking and access. At present, five formally marked busparks are available.The central area provides five bays of nine 60-degree angle parks and one bay of six standard60-degree angle parks and two 60-degree disabled parks, totalling 53 parks. At present this isthe area most used for parking as it provides the closest parks to the terminal entrance. Twozebra crossings provide safe access between the parking area and the terminal.The most western area consists of five bays of 25 No. 90-degree parks, totalling 125 parks.A ring road surrounds the parking area.Lighting of the existing car park exists and is deemed to be sufficient.Through discussions with current airport management and from visual inspection it is apparentthat the current car parking facility is significantly under-utilised. Current users of the car parkingfacilities are generally confined to local users and hire car parking. At present the majority oftourists utilise a third party for transport, either by bus or by an eco-tour with a driver pickingthem up upon arrival.7.1.2 Future Car Parking RequirementsAs mentioned previously it is apparent that the existing car parking facilities are significantlyunder-utilised. The current facility has a total of 178 car parks currently available for public carparking, including two disabled car parks. It is intended that hire cars for pick up will also use theparking available in this facility.Determination of future car park needs requires some conjecture as to the likely vehicle use ofthe passengers arriving on the larger flights from interstate. The vast majority of people arrivingby interstate flights are likely to be tourists and will therefore require transport via one of thefollowing methods:- Hire car; Tourist coach; Eco Tour Vehicle (private tour guide); Picked up by a friend.The final option of being picked up by a friend is considered to be of minimal likelihood incomparison to the other three options. Therefore the requirements for upgrading the parkingfacility needs to consider these three options individually as they each have differentrequirements for parking.Ref No. 20120935DR1A <strong>Kingscote</strong> <strong>Airport</strong> Infrastructure Study Report 19
7.1.3 Parking for Eco-Tour VehiclesIt is anticipated that a large number of tourists travelling from interstate are likely to be met byprivate tour guide in a regular vehicle, most likely a four wheel drive. Potential exists for a trailerin these types of tours. These tourists will be picked up at the terminal by their guide.A tour operator will require short term parking with relative ease for loading of baggage into thevehicle or trailer. As the facility currently exists, the western area is the most logical place to parka vehicle with a trailer as it provides two 90 degree parks end to end. A number of parks in thesouthern-most bay could be reserved for ‘trailer parking’ if required.It is expected that the number of vehicles utilising trailers will be limited, so the main focus will beon single vehicles requiring short term parking. It is recommended that short term parking shouldbe located as close as practically possible to the area being accessed, with longer term parkingutilising the furthest parks. The closest available parks to the proposed upgraded terminal exitare the parallel parks adjacent the terminal, followed by the angle parks in the central area.The parallel parks adjacent to the terminal would most logically be reserved for pick up where thedriver is not required to leave the vehicle. This would most likely be used by taxis or by localsarriving home or people being picked up by locals. In the case of the eco-tours it is likely that thetour operator will meet and greet their clients within the terminal, so it is therefore notrecommended that the parallel parks be used for this purpose.Instead it is recommended that the angled parks would be the most suitable parks for the ecotourguides travelling without a trailer, as well as short term pickup where drivers are leaving theirvehicles.Safety must be a priority when considering any parking facility. Two zebra crossings exist outsidethe existing terminal entrance to the terminal. This is deemed to be sufficient given for ongoinguse.Tourist CoachesAs previously mentioned the existing facility includes five parks for coaches or buses in theeastern area. Buses enter through the main public entrance from Arranmore Road. They thenmake a left turn into the entrance to the bus parking area. Through discussions with airportmanagement it appears that buses and coaches of all sizes currently utilise these parks, and it israre for all parks to be used concurrently. The bus parks will generally only be used for arelatively short time when an aircraft lands.Given the projected numbers of increased tourists arriving from interstate on aircraft ofpassenger capacity of 78, 107 or 170 it is very likely that the number of buses arrivingsimultaneously is going to increase. However it is not expected that more than five buses will bea regular event. Furthermore, if the parks were reserved for buses of a certain minimum capacity,say 24, the smaller buses could utilise the parks in another area. Similarly to the eco-tours, two90 degree parks end to end could be converted to provide parking for the smaller buses.To cater for the rare occasion where more than five large buses are present a holding zone couldbe implemented. This would involve marking an area for a bus to wait until a park becameavailable. Based on the current layout it is expected that four coaches could wait in the existingbus area access road without disrupting any other traffic. Some busses could also park behindoccupied bus bays, although it is acknowledged that in doing so they would not be free to leaveuntil the bus parked in front of them leaves.Hire CarsThrough discussions with airport management the number of hire cars parked at the airportduring peak season is approximately 30 vehicles. This large number is partially attributable tothe fact that these companies do not have alternative depots or bases as is more commonly thecase in other centres.Ref No. 20120935DR1A <strong>Kingscote</strong> <strong>Airport</strong> Infrastructure Study Report 20
This situation will require monitoring by Council as the number of visitors to the <strong>Island</strong> arriving byair increases, and the associated demand for hire cars to be collected and dropped off at<strong>Kingscote</strong> <strong>Airport</strong> rises.7.1.4 Additional Car Parking ProposalsBased on the existing level of car ark use it appears that the existing car parking facilities couldbe better utilised to improve efficiency. It is believed that no significant upgrades to the existingcar parking facilities are required, other than minor road marking and signage augmentation.7.2 Infrastructure Services7.2.1 ElectricityElectricity is currently provided to the site from Arranmore Road. A transformer is located in asection of the reserve opposite the existing terminal entrance. Current electricity demands of thesite are unknown however it has been assumed that scenarios 2, 3 and 4 will require a newtransformer to provide adequate supply. Increased electrical demands will be due to:- Increased electrical demands inside the upgraded terminal; Increased lighting for the upgraded runway;An amount for a new transformer has been allowed for each of Scenarios 2, 3 and 4. However,no contact has been made with SA Power Networks to establish whether there is a need forupstream headworks, and whether a capital contribution would be sought.7.2.2 Water SupplyThe site is currently supplied by a 32mm water meter at the north-western corner of the site. Inaddition, there is apparently a separate fire service (since there are existing fire mains and firehydrants adjacent to the terminal building), although the size of this main has not beenestablished.The peak water demands of the site should not be significantly increased by the upgrade.Increased water demands will be due to:- A second set of toilets and higher use of toilets; Extra lighting associated with the increased floor area of the building New kiosk area (cold rooms, refrigeration, cooking equipment, etc.);Perhaps a more significant issue would be fire-fighting demands, should the larger futureterminal building require sprinklers in line with Building Code of Australia. However, it isexpected that the existing fire service could adequately serve that type of system.It is not anticipated that the water supply infrastructure to the site will be required to beincreased. If necessary, an option for ensuring a constant source of potable and / or fire water infuture would be to have on-site storage tanks and booster pumps arrangement. The tank wouldbe filled from the existing mains supply during low demand periods. Instantaneous waterdemands for the new terminal would be drawn from the on-site tank by the booster pump.On this basis no allowance has been made for upgrades to the water supply infrastructure.7.2.3 Liquid Waste DisposalThe liquid waste from the terminal is currently disposed of to a septic tank. This has a liquidoverflow tank located in the fenced off area at the north eastern edge of the car park facilityadjacent to the bus parking area access road. This empties into a soakage trench to the north.Ref No. 20120935DR1A <strong>Kingscote</strong> <strong>Airport</strong> Infrastructure Study Report 21
The new toilets and kiosk areas would most likely require a either a separate septic system, orthe current system would need to be upgraded to allow for the additional volume of liquid wastebeing produced within the terminal.An amount has been allowed for either the upgrade of existing system, or provision of a separatesystem. This amount differs for each option as the size of the septic tank and associatedinfrastructure will vary based on the number of predicted users.7.2.4 CommunicationsThe existing terminal has adequate communications for operating as an airport terminal. Alarger terminal building may require additional phone and data lines. It is assumed that thesewould be applied for through Telstra in the normal way, and that no unusual capital contributionwould be sought by that authority.A communications tower is located to the west of the existing terminal and is clear of theproposed footprint of the upgraded terminal. It is not foreseeable that the communicationsinfrastructure will require to be upgraded as part of Scenarios 2, 3 or 4 and therefore noallowance has been made for this.Ref No. 20120935DR1A <strong>Kingscote</strong> <strong>Airport</strong> Infrastructure Study Report 22
8 Capital Costs Estimates8.1 IntroductionBased on the findings of the previous sections of this report a cost estimate has been producedfor each of the four scenarios. The cost estimates show the capital costs of the work assumingthat the works are not to be staged, i.e. Stage 2 does not lead into Stage 3, rather the capitalcost estimates for both scenarios 2 and 3 are based on upgrading the existing infrastructure tothat design option. In addition a summary of anticipated annual costs have been presented forbudgeting purposes.8.2 Methodology8.2.1 Development Scenario 1Scenario 1 does not include any capital expenditure, and as such no construction cost estimatehas been produced. Maintenance costs and depreciation values have however been presented.The maintenance costs are based on <strong>Kangaroo</strong> <strong>Island</strong> Council’s current maintenance spendingof the airport. Depreciation values are based on Tonkin Consulting’s <strong>Kingscote</strong> <strong>Airport</strong>Infrastructure Valuation Report produced in October 2009 (Ref: 20080694RA2-B).8.2.2 Development Scenarios 2 – 4Scenarios 2, 3 and 4 have each had a construction cost estimate produced. Quantities for newinfrastructure are based upon the layouts produced as part of this report. Quantities of existinginfrastructure (such as existing runway pavement thickness) have been taken from historicdocuments and on site investigations.Unit rates have been compiled from a number of sources. Various rates have been madeavailable through Tonkin’s previous <strong>Kangaroo</strong> <strong>Island</strong> Council asset management work. Otherrates have been specifically sourced as part of this report. Where no other means for sourcingrates was available Tonkin Consulting has used rates obtained through similar projects. Anappropriate ‘KI Factor’ has been added to these rates to cater for the provision of services and/ormaterials on <strong>Kangaroo</strong> <strong>Island</strong> as opposed to the main land.A contingency of 12.5% has been included as part of the calculations, as “brown-field”construction projects inherently have unforeseen costs. In addition, given the nature of theseestimates being based on concept designs it is more likely that unforeseen costs could berevealed during construction.8.3 Summary of Costs for Each Development ScenarioTable 8-1 shows a summary of the capital expenditure costs for scenarios 2, 3 and 4.Table 8-1 Capital Cost Summary for Scenarios 2, 3 and 4Item Scenario 2 Scenario 3 Scenario 4Preliminaries $615,000 930,000 $2,015,000Site Preparation and Earthworks $71,666 $401,864 $1,065,278Stormwater $134,712 $634,112 $634,112Pavement $2,436,900 $5,850,284 $15,956,578Lighting $362,800 $544,300 $584,300Terminal $3,917,250 $4,492,125 $8,804,000Design Fees $400,000 $600,000 $1,450,000Total (Excluding GST) $7,938328 $13,452,685 $29,924,967Ref No. 20120935DR1A <strong>Kingscote</strong> <strong>Airport</strong> Infrastructure Study Report 23
Item Scenario 2 Scenario 3 Scenario 4Contingencies (12.5%) $992,291 $1,681,586 $3,740,621Total (Including Contingencies) $8,930,620 $15,134,271 $33,665,588GST (10%) $893,062 $1,513,427 $3,366,559CITF Levy (0.25%) $24,559 $41,619 $92,580Total (All Inclusive) $9,848,241 $16,689,317 $37,124,727A more detailed breakdown of these costs can be seen in Appendix D.As expected that major items for all scenarios are pavement upgrade and terminal upgrade.8.3.1 Basis for Capital Cost EstimatesThe capital cost estimates above and further detailed in Appendix D are expressed in October2012 Australian dollar terms. They include 10% GST. They are based on current, knownstatutory requirements, and on the latest versions of Standards Australia publications.No allowance has been made for extraordinary circumstances, such as excavation in rock,controlling and disposing of groundwater inflows, dealing with contaminated soils, etc.Judgements have been made as to down-time and inefficiency associated with dealing with airtraffic during construction of airside works. Allowance has been made in the estimates for theterminal building extension for Scenarios 2 and 3 for maintenance of safe and efficient operationof the existing building whilst the extension are being constructed.8.3.2 Scenario Cost ComparisonsAs mentioned previously the scenarios have not been staged, i.e. Scenario 2 does not precedethe construction of Scenario 3. However this section provides some discussion on the feasibility,when constructing Scenario 2, of increasing the standard of that work so that it would also meetScenario 3 needs. The benefit of such consideration is the avoidance of future re-work andwastage, should it be decided to further upgrade the airport at some future time. For instance,consideration could be given to constructing the scope of pavement work required for Scenario 2to the higher Scenario 3 standard. If it was decided in future to further upgrade the airport tocater for Scenario 3, the work then would comprise the necessary scope extension only, andthere would be no need to re-work that undertaken previously for Scenario 2.A similar logic could be applied between Scenarios 3 and 4 pavement requirements. This logicwould be more difficult to put into practice for the terminal building. Rather, it is more likely thatconsideration be given to constructing a larger building that actually required for a particularscenario. For instance, consideration could be given to constructing the Scenario 3 terminalbuilding at the Scenario 2 development stage.Table 8.2 below sets out the proposed pavement construction for each development Scenario,and the associated per square metre cost of new pavements. It also shows overlayrequirements (over the existing pavement), and their per square metre cost.Ref No. 20120935DR1A <strong>Kingscote</strong> <strong>Airport</strong> Infrastructure Study Report 24
Table 8-2Pavement Element Comparison (All prices exclusive of GST, contingencies, etc.)Item Scenario 2 Scenario 3 Scenario 4Sand Layer 150mm 180mm 230mmSub-base layer 220mm 330mm 270mmBase-course layer 150mm 150mm 300mmCost of new pavement (per sqm) $49.00/sqm $62.40/sqm $75.40/sqmOverlay layer Nil 150mm 300mmCost of overlay layer (per sqm) $0.00/sqm $15.00/sqm $30.00/sqmIn short, no overlay is required over the existing pavement to cater for development Scenario 2 –merely a new bitumen surface. An additional 150mm thick pavement course would need to beconstructed on the Scenario 2 pavements to cater for Scenario 3. This additional cost wouldamount $1,052,000 excluding GST, but the only savings in such early investment would beavoidance of the loss of the initial bitumen seal. The cost of the seal would be approximately$800,000 excluding GST, but if it is near the end of its service life its effective value at the time ofthe upgrade to Scenario 3, the effective “loss” would be much less than that and possiblyeffectively zero.Consequently, there appears to be no financial benefit in constructing pavements suitable forScenario 3 now when development scenario 2 is being adopted as the proposed strategy. Asimilar conclusion can be reached in relation to providing pavements suitable for Scenario 4,when the adopted strategy is Scenario 3.In relation to the terminal building, it will be seen from the capital cost estimates that provision -at the Scenario 2 development stage - of a building over-sized so as to cater for a future upgradeof the airport to Scenario 3, would involve an early investment of approximately $700,000. Inaddition, there would a small penalty associated with increased annual cost associated with thelarger building.8.4 Annual CostsAnnual costs will consist of both the cost of maintaining the airport infrastructure, thedepreciating value of the assets that make up the airport, and other ongoing costs that will applyto the running of the airport. For the purposes of this report no allowances have been made forthe provisions of services or utilities.8.4.1 Maintenance CostsIn addition to capital costs, the maintenance costs for each scenario (including Scenario 1) havebeen considered. These are summarised in Table 8-3.Table 8-3Summary of Maintenance CostsItem Scenario 1 Scenario 2 Scenario 3 Scenario 4Runway Pavements $11,500 $12,800 $16,200 $26,300Apron Pavements $2,500 $2,700 $2,700 $3,000Stormwater $2,000 $3,000 $3,000 $3,000Terminal $37,500 $151,000 $162,500 $306,900Lighting - $5,000 $6,800 $8,100TOTAL $53,500 $173,500 $190,200 $346,300It should be noted that maintenance costs have only been allowed for items of infrastructure thathave been included as part of the upgrades. Therefore maintenance for infrastructure such asRef No. 20120935DR1A <strong>Kingscote</strong> <strong>Airport</strong> Infrastructure Study Report 25
the unsealed runways has not been included in these estimates as no upgrade of these hasbeen considered.The Scenario 1 maintenance costs have been obtained directly from <strong>Kangaroo</strong> <strong>Island</strong> Counciland reflect the current budget for maintenance on the relevant pieces of infrastructure at theexisting airport.To obtain the estimates for Scenarios 2, 3 and 4 the existing maintenance budget has beenproportionally applied to the increased size of the upgraded infrastructure. For example, theexisting maintenance budget for the Scenario 1 terminal is $37,500. The terminal for Scenario 2is approximately four times larger (in terms of floor space) and therefore the budget formaintenance has been assumed to be four times that of the existing budget.The dollar values applied to the maintenance costs for each scenario are in current day valueand have not taken into account inflation over time, nor have they made allowance for majorreplacements.8.4.2 Depreciation CostsThe cost of annual depreciation of the airport assets can be calculated by defining the currentvalue of all assets and the remaining useful life of those assets. For Scenario 1, this informationhas been obtained from a Tonkin Consulting investigation into asset valuation of the <strong>Kingscote</strong>airport.For Scenarios 2, 3 and 4 these values have been calculated by dividing the capital cost of theupgraded assets defined as part of this study by the design life of these assets. In addition, thedesign life of existing assets has been adjusted to suit their particular situation post-construction(e.g. the useful life of an existing top pavement layer can reasonably be extended where it is tobe overlaid). Scrapped assets have been have had their value written off.The following design life has been assigned in these depreciation calculations to the various newassets below: X-ray screening equipment The re-fuelling facility Humeceptor for re-fuelling apron Scenario 2 spray seal Scenario 3 spray and emulsion sand seal Scenario 4 hot mix surface New base course layers New sub-base layers Existing pavements beneath overlays20 years30 years50 years15 years15 years25 years50 years100 years100 yearsTable 8-4 shows the estimated annual depreciation costs in present day values for each scenarioas part of this study.Table 8-4ScenarioAnnual Depreciation ValuesAnnual Depreciation ValueScenario 1 $271,289Scenario 2 $479,763Scenario 3 $547,384Scenario 4 $947,896Ref No. 20120935DR1A <strong>Kingscote</strong> <strong>Airport</strong> Infrastructure Study Report 26
8.4.3 Security Screening CostsIn addition it is estimated that an annual running cost of $800,000.00 would apply for theupgraded security screening for Scenarios 2, 3 and 4. This value is based on the assumptionthat six personnel will be required for an average of four hours per day (2 outbound flights andmanning required for 2 hours for each flight), 365 days per year to run the security screeningprocess. At an estimated $80 per hour, this equates to approximately $700,000.00 per year, withan allowance for an additional $100,000.00 per year for annual incidental costs associated withthe screening process (e.g. equipment servicing and calibration, training of new personnel, etc.).This annual value is consistent with the anticipated cost (informally advised) to operate thesepassenger and baggage screening services at Port Lincoln <strong>Airport</strong> costs of a newly installedscreening process.8.4.4 Annual Costs SummaryWhen combined with the maintenance costs associated with each corresponding scenario aswell as the running costs of the security screening process, Table 8-5 shows the estimated totalannual cost of the airport for each scenario.Table 8-5Total Annual CostsScenarioTotal Annual CostsScenario 1 $ 334,789Scenario 2 $1,453,263Scenario 3 $1,537,584Scenario 4 $2,094,1968.5 Anticipated Cash FlowIrrespective of the Scenario adopted, it is feasible for the construction of the upgrade project tobe undertaken in a single financial year. Generally favourable weather conditions could beexpected between 1 October and 31 May. Also, there is no reason why the airside facilities andthe terminal building construction could not take place concurrently.However, that implies that all design work would have been completed in the previous financialyear, and possible some commitment would be made to preparatory works. This could equate to10% of the total project value.In addition, all construction work would be subject to a 12-month defects guarantee, possibleamounting to 5% of the total project value. This portion would not have to be expended until theyear following construction.In summary, project cash flow is likely to be spread over 3 years as follows: Year 1 Design and Preparatory Works 10% of total project cost Year 2 Construction 85% of total project cost Year 3 Defects Guarantee Period 5% of total project cost8.6 Local Expenditure ProportionIt was assumed that scenarios 2, 3 and 4 were of significant enough size that a major civilcontractor from the main land would most likely be awarded the contract. Therefore the majorityof the wages would not be retained on the <strong>Island</strong>.Table 8-6 on the following page shows a summary of the spending for each of these scenariosboth on and off <strong>Kangaroo</strong> <strong>Island</strong>. These costs are inclusive of GST and contingencies.The following items summarise which costs were believed to be completely local expenditure:-Ref No. 20120935DR1A <strong>Kingscote</strong> <strong>Airport</strong> Infrastructure Study Report 27
Supply of sand material; Supply of pavement material (excluding rock for spray seals and hot-mix seals); Contractor employee accommodation and meals.Table 8-6Summary of Spending Breakdown<strong>Island</strong> SpendingMainland Spending% of Total SpendingRetained on KIScenario 2 $677,566 $9,170,675 6.9%Scenario 3 $2,836,087 $13,853,230 17.0%Scenario 4 $7,918,284 $29,931,322 21.3%From Table 8-6 it can be seen that as the size of the upgrade increased, so does the localspending. This is largely due to the increased size of the runway and thus the increased volumesof pavement material required for these scenarios. In addition it should be noted that the largerprojects will also require a longer construction period and/or more contractors. This means thatlocal spending on accommodation and food will also increase during the construction period.The foregoing analysis almost certainly under-estimates the <strong>Kangaroo</strong> <strong>Island</strong> component of theproject cost. It is highly likely that Adelaide based contractors would make some use of locallabour, plant and subcontractors. Not all activities would require highly skilled or specialisedresources. However, it is difficult to quantify this additional local content. Some assumptions inthis regards could reasonably be made during the economic analysis, but no guidance is able tobe offered herein.Ref No. 20120935DR1A <strong>Kingscote</strong> <strong>Airport</strong> Infrastructure Study Report 28
Appendix A<strong>Kingscote</strong> <strong>Airport</strong> – Current Infrastructure<strong>Airport</strong> Master PlanExisting Terminal BuildingLandside FacilitiesRef No. 20120935DR1A<strong>Kingscote</strong> <strong>Airport</strong> Infrastructure Study Report
Appendix B<strong>Kingscote</strong> <strong>Airport</strong>Future Infrastructure - Sketch PlansFigure 2 Scenario 2 – Airside Layout PlanFigure 3 Scenario 3 – Airside Layout PlanFigure 4 Scenario 4 – Airside Layout PlanFigure 5 Scenario 2 – Terminal Building (including additionalrequirements for Scenario 3)Figure 6 Scenario 4 – Terminal Building SitingNote:There is no Figure 1 included in this ReportRef No. 20120935DR1A<strong>Kingscote</strong> <strong>Airport</strong> Infrastructure Study Report
Appendix CCalculations Terminal Building - Estimated Spatial Requirements –Scenarios 2, 3 & 4Ref No. 20120935DR1A<strong>Kingscote</strong> <strong>Airport</strong> Infrastructure Study Report
Calculation Basis - Building Spatial Requirements<strong>Kangaroo</strong> <strong>Island</strong> Council<strong>Kingscote</strong> <strong>Airport</strong> Infrastructure StudyTerminal BuildingEstimate of Spatial Requirements - Scenarios 2, 3 & 4Scenario 2 - Bombardier Q400with Saab 340 being catered forsimultaneouslyScenario 3 - Fokker F100 withSaab 340 being catered forsimultaneouslyScenario 4 - B 737 withSaab 340 being catered forsimultaneouslyRev 110-Oct-12Comparison - New Port LincolnTerminal BuildingNo. of Seats (both planes) 78 + 36 = 114 107 + 36 = 143 170 + 36 = 206Assumed Occupancy 80% 80% 80%Passenger Nos. for Design 91 114 165Building ComponentProportion ofPassengersBuilding DesignParameterUnitPassenger Check-in &Ticketing 0.4 2 m2 / passenger 73 92 132plus allow for friend (50%) 0.5 1.5 m2 / friend 68 86 124 360plus circulation allowance 10 % 14 18 26Check-in counters 3 No. 3m x 5m 45 45 45 70Baggage Make-up (incl. X-ray screening) 1 2 m2 / passenger 182 229 330 415Freight Store 10 12 15 40Security Office 12 12 12 10Secured Gate LoungePassenger Screening 40 50 60 72Lounge 1 1.5 m2 / passenger 137 172 247Allowance for friend 0.3 1 m2 / passenger 27 34 49 220Circulation allowance 20 % 33 41 59Baggage Reclaim 1 1.2 m2 / passenger 109 137 198Allowance for friend 0.3 1 m2 / passenger 27 34 49 330Circulation allowance 20 % 27 34 49Arrivals Hall 1 1.25 m2 / passenger 114 143 206Allowance for friend 0.3 1 m2 / passenger 27 34 49 180Circulation allowance 20 % 28 35 51MiscellaneousAirline Offices 30 40 50 50Car Hire Offices 50 50 50 50Other Concessions 0 10 20 0<strong>Airport</strong> Manager 15 15 15 0Interview Rooms 15 15 30 21Toilets 40 55 80 137Plant Rooms 6 6 10 0Entrance Airlock 20 20 20 20Café 72 72 140 130Alfresco 0 0 0 55Total Floor Areas (m2) 1224 1492 2117 2160Scenario 2 Scenario 3 Scenario 4 Proposed - Port Lincoln
Appendix DCapital Cost Estimates Scenario 2 Scenario 3 Scenario 4Ref No. 20120935DR1A<strong>Kingscote</strong> <strong>Airport</strong> Infrastructure Study Report
<strong>Kingscote</strong> Airfield Review<strong>Kangaroo</strong> <strong>Island</strong> CouncilConstruction Cost Estimate for Option 2, Bombardier Q400Revision: BJob No. 2010.1278Estimated: TG/MDS26-Oct-12Reviewed: BEMItem DescriptionComment/Assumptions Unit Quantity Rate Total Cost - KI Cost - Mainland1.0 Preliminaries1.01 EstablishmentItem 1 $ 125,000.00 $ 125,000.00 $ 12,500.00 $ 112,500.001.02 Demobilisation (including clean up)Item 1 $ 90,000.00 $ 90,000.00 $ 9,000.00 $81,000.001.03 Administration, PMP, EMP, QMS, OHSItem 1 $ 85,000.00 $ 85,000.00 $ 8,500.00 $76,500.001.04 Engineering - Setting out/SurveyItem 1 $ 25,000.00 $ 25,000.00 $ 22,500.00 $2,500.001.05 Testing (as specified)Item 1 $ 60,000.00 $ 60,000.00 $ 6,000.00 $54,000.001.06 Service locationItem 1 $ 20,000.00 $ 20,000.00 $ 18,000.00 $2,000.001.07 Insurances: Construction work & Public LiabilityItem 1 $ 40,000.00 $ 40,000.00 $ 4,000.00 $36,000.001.08 Silt ControlItem 1 $ 15,000.00 $ 15,000.00 $ 1,500.00 $13,500.001.09 Traffic ControlItem 1 $ 40,000.00 $ 40,000.00 $ 4,000.00 $36,000.001.10 Tree clearing/trimming in flight pathItem 1 $ 15,000.00 $ 15,000.00 $ 15,000.001.11 As-Constructed SurveysItem 1 $ 20,000.00 $ 20,000.00 $ 18,000.00 $2,000.001.12 Accommodation and MealsItem 1 $ 80,000.00 $ 80,000.00 $ 80,000.00Sub-Total$ 615,000.00 $ 199,000.00 $ 416,000.002.0 Site Preparation and Earthworks2.01 Strip top soil (100mm), stockpile, and respread on completed battersApplicable to all areas of earthworks m2 6168 $ 7.88 $ 48,573.00$48,573.002.02 Excavate material for runway extension and lengthening (520mm), stockpile on sitem3 3207.36 $ 7.20 $ 23,092.99$23,092.992.03 Place and compact stockpiled fill adjacent runwayTo match new finished runway level, grade at max 2.5% m3 0 $ 9.30 $ -$-2.04 Place and compact imported fill adjacent runwayTo match new finished runway level, grade at max 2.5% m3 0 $ 37.50 $ -$-Sub-Total$ 71,665.99 $ - $71,665.993.0 Stormwater3.01 Supply and construct protective concrete slab above existing 600mm RCP2000mm wide, 300mm thick, 20,000mm long 25 MPareinforced concrete slab3.02 Supply and construct protective concrete slab above existing 675mm RCP underneath 2000mm wide, 300mm thick, 280m long 25 MpaApron SealReinforced concrete slab. Assumed pipe will requireprotection. Check can be done to determine if structuralloading will exceed pipe capacity at later stage.m3 12 $ 337.50 $ 4,050.00$4,050.00m3 168 $ 337.50 $ 56,700.00$56,700.003.03 Pit adjustments of 675mm RCP underneath Apron SealClass D - V grates and concrete surround. Supply and each 3 $ 2,079.00 $ 6,237.00$6,237.00install new surrounds.3.04 Infill existing 300mm RCP with controlled low strength materialFlowable Self levelling cementitious material - Rawlinsons m3 53.0 $ 210.00 $ 11,133.02$11,133.0220123.05 Supply and Install Humeceptor Gross Pollutant TrapItem 1 $ 56,592.00 $ 56,592.00$56,592.00Sub-Total$ 134,712.02 $ - $ 134,712.024.0 PavementsRunway Pavement4.01 Shape and compact existing sub-gradem2 6,168 $ 7.50 $ 46,260.00$46,260.004.02 Supply, place and compact 150mm sandm2 6,168 $ 12.00 $ 74,016.00 $ 51,811.20 $22,204.804.03 Supply, place and compact 220mm PM2/20 QRm2 6,168 $ 22.00 $ 135,696.00 $ 94,987.20 $40,708.804.04 Supply, place and compact 150mm PM1/20m2 6,168 $ 15.00 $ 92,520.00 $ 64,764.00 $27,756.004.05 Profiling of Existing Seal - Disposal on sitem2 56,159 $ 12.00 $ 673,908.00$ 673,908.004.06 Supply and place 2 coats of 10/7 spray seal (including Prime Coat)0.9L/sqm cut-back bitumen for prime coat m2 62,327 $ 13.28 $ 827,702.56$ 827,702.56Apron Pavement4.07 Shape and compact existing sub-gradem2 0 $ 7.50 $ - $ - $-4.08 Supply, place and compact 150mm sandm2 0 $ 12.00 $ - $ - $-4.09 Supply, place and compact 220mm PM2/20 QRm2 0 $ 22.00 $ - $ - $-4.10 Supply, place and compact 150mm PM1/20m2 0 $ 15.00 $ - $ - $-4.11 Profiling of Existing Seal - Disposal on sitem2 20,805 $ 12.00 $ 249,660.00$ 249,660.004.12 Supply and place 2 coats of 10/7 spray seal (including Prime Coat)0.9L/sqm cut-back bitumen for prime coat m2 20,805 $ 13.28$ 276,290.40$276,290.404.13 Supply and place spray sealed pavement from baggage collection area to apron Assumed 150mm of Rubble, 150mm of base course and m2 125 $ 50.78 $ 6,347.50$6,347.5010/7 spray seal4.14 Linemarkingitem 1 $ 49,500.00 $ 49,500.00$49,500.004.15 Relocation of Helicopter Parking Areaitem 1 $ 5,000.00 $ 5,000.00$5,000.00Sub-Total$ 2,436,900.46 $ 211,562.40 $ 2,225,338.065.0 Lighting5.01 Supply and Install new runway marker lightsassumed lighting on figures indicative of actual lighting each 6 $ 5,000.00 $ 30,000.00$30,000.00requirements5.02 Relocation of existing apron and taxiway A marker lightslin m 26 $ 3,500.00 $ 91,000.00$91,000.005.03 Relocation of end of runway threshold lightsitem 16 $ 4,800.00 $ 76,800.00$76,800.005.04 Supply and Install new Precision Approach Path Indicator (PAPI)each 1 $ 150,000.00 $ 150,000.00$ 150,000.005.05 Apron lightingItem 1 $ 15,000.00 $ 15,000.00$15,000.00Sub-Total$ 362,800.00 $ - $ 362,800.006.0 Building6.01 Building ConstructionIncludes substructure, superstructure, internal fitout, m2 904 $ 3,000.00 $ 2,712,000.00 $ 135,600.00 $ 2,576,400.00fencing relocation6.02 Security equipmentitem 1 $ 1,000,000.00 $ 1,000,000.00$ 1,000,000.006.03 Supply and Install Septic Systemitem 1 $ 35,250.00 $ 35,250.00$35,250.006.04 Relocation of ServicesItem 1 $ 20,000.00 $ 20,000.00$20,000.006.05 Upgrade of refueling facilityitem 1 $ 150,000.00 $ 150,000.00$ 150,000.00Sub-Total$ 3,917,250.00 $ 135,600.00 $ 3,781,650.007.0 Design Fees7.01 Detailed Design Fees5% of construction fees Item 1 $ 400,000.00$ 400,000.00$400,000.00Sub-Total$ 400,000.00 $ - $ 400,000.00TOTAL CIVIL WORKS (EX GST)CONTINGENCIESTOTAL CIVIL WORKS inc. CONTINGENCIES (EX GST)GST (10%)CITB (0.25%)GRAND TOTAL(inc GST & CONTINGENCY)$ 7,938,328.47 $ 546,162.40 $ 7,392,166.0712.5% $ 992,291.06 $ 68,270.30 $ 924,020.76$ 8,930,619.53 $ 614,432.70 $ 8,316,186.83$ 893,061.95 $ 61,443.27 $ 831,618.68$ 24,559.20 $ 1,689.69 $22,869.51$ 9,848,240.69 $ 677,565.66 $ 9,170,675.03Note:Note:Note:Note:This is a preliminary cost estimate and has been prepared based on information provided to Tonkin Consulting and upon experience and historical unit rates. Tonkin Consulting takes no responsibility for any variations- Latent conditions- Changes in scope- Market conditions (i.e. competition, escalation)- No allowance for site contamination and remediation- No allowance for Rock excavation- No allowance has been made for the staging of these works- No allowance has been made for landscaping or revegetation- Assumed that items supplied from mainland but installed by local contractors will be assigned a ration of 20% KI to 80% mainlandThe following items included in the estimate are provisional only:-- Earthworks quantities- Road areasTonkin Consulting recommend that a professional Quantity Surveyor be engaged if assurance of cost is required and project budget estimates allowing for these factors are required.Rates adjusted for <strong>Kingscote</strong> Regional Indices
<strong>Kingscote</strong> Airfield Review<strong>Kangaroo</strong> <strong>Island</strong> CouncilConstruction Cost Estimate for Option 3, Fokker 100Revision: BJob No. 2010.1278Estimated: TG/MDS26-Oct-12Reviewed: BEMItem DescriptionComment/Assumptions Unit Quantity Rate Total Cost - KI Cost - Mainland1.0 Preliminaries1.01 EstablishmentItem 1 $ 180,000.00 $ 180,000.00 $ 18,000.00 $162,000.001.02 Demobilisation (including clean up)Item 1 $ 150,000.00 $ 150,000.00 $ 15,000.00 $135,000.001.03 Administration, PMP, EMP, QMS, OHSItem 1 $ 100,000.00 $ 110,000.00 $ 11,000.00 $99,000.001.04 Engineering - Setting out/SurveyItem 1 $ 40,000.00 $ 40,000.00 $ 36,000.00 $4,000.001.05 Testing (as specified)Item 1 $ 70,000.00 $ 70,000.00 $ 7,000.00 $63,000.001.06 Service locationItem 1 $ 25,000.00 $ 25,000.00 $ 22,500.00 $2,500.001.07 Insurances: Construction work & Public LiabilityItem 1 $ 50,000.00 $ 50,000.00 $ 5,000.00 $45,000.001.08 Silt ControlItem 1 $ 25,000.00 $ 25,000.00 $ 2,500.00 $22,500.001.09 Traffic ControlItem 1 $ 50,000.00 $ 50,000.00 $ 5,000.00 $45,000.001.10 Tree clearing/trimming in flight pathItem 1 $ 50,000.00 $ 50,000.00 $ 50,000.001.11 As-Constructed SurveysItem 1 $ 30,000.00 $ 30,000.00 $ 27,000.00 $3,000.001.12 Accommodation and mealsItem 1 $ 150,000.00 $ 150,000.00$150,000.00Sub-Total$ 930,000.00 $ 199,000.00 $731,000.002.0 Site Preparation and Earthworks2.01 Strip top soil (100mm), stockpile, and respread on completed battersApplicable to all areas of earthworks m2 22668 $ 7.88 $ 178,510.50$178,510.502.02 Excavate material for runway extension and lengthening (510mm), stockpile on sitem3 11560.68 $ 7.20 $ 83,236.90$83,236.902.03 Place and compact stockpiled fill adjacent runwayTo match new runway level, grade at max 2.5% m3 11560.68 $ 9.30 $ 107,514.32$107,514.322.04 Place and compact 150mm x 3m Quarry Rubble adjacent runway, apron and taxiway A To match new runway level, grade at max 2.5% m3 2173.5 $ 15.00 $ 32,602.50 $ 22,821.75 $9,780.75Sub-Total$ 401,864.22 $ 22,821.75 $379,042.473.0 Stormwater3.01 Supply and construct protective concrete slab above existing 600mm RCP2000mm wide, 300mm thick, 20,000mm long 25 MPa m3 12 $ 337.50 $ 4,050.00$4,050.00concrete slab3.02 Supply and construct protective concrete slab above existing 675mm RCP underneath 2000mm wide, 300mm thick, 280m long 25 Mpa m3 168 $ 337.50 $ 56,700.00$56,700.00Apron SealReinforced concrete slab. Assumed pipe will requireprotection. Check can be done to determine ifstructural loading will exceed pipe capacity at laterstage.3.03 Pit adjustments of 675mm RCP underneath Apron SealClass D - V grates and concrete surround. Supply and each 3 $ 2,079.00 $ 6,237.00$6,237.00install.3.04 Infill existing 300mm RCP with controlled low strength materialFlowable Self levelling cementitious material -m3 53.0 $ 210.00 $ 11,133.02$11,133.02Rawlinsons 20123.05 Supply and lay DN 1350 RCP at intersection of south perimeter O.U.D and runwaylin m 150 $ 3,300.00 $ 495,000.00$495,000.003.06 Supply and install DN1350 precast concrete headwallseach 2 $ 2,200.00 $ 4,400.00$4,400.003.07 Supply and Install Humeceptor Gross Pollutant TrapItem 1 $ 56,592.00 $ 56,592.00$56,592.00Sub-Total$ 634,112.02 $ - $634,112.024.0 PavementsRunway Pavement4.01 Shape and compact existing sub-gradem2 22,668 $ 7.50 $ 170,010.00$170,010.004.02 Supply, place and compact 180mm sandm2 22,668 $ 14.40 $ 326,419.20 $ 228,493.44 $97,925.764.03 Supply, place and compact 330mm PM2/20 QRm2 22,668 $ 33.00 $ 748,044.00 $ 523,630.80 $224,413.204.04 Profiling of Existing Seal - Disposal on sitem2 56,159 $ 12.00 $ 673,908.00$673,908.004.05 Supply, place and compact 150mm PM1/20m2 78,827 $ 15.00 $ 1,182,405.00 $ 827,683.50 $354,721.504.06 Supply and place 2 coats of 10/7 spray seal (including Prime Coat)0.9L/sqm cut-back bitumen for prime coat m2 78,827 $ 12.73 $ 1,003,467.71$ 1,003,467.714.07 Supply and Place Sand Emulsion Coatm2 78,827 $ 6.37 $ 501,733.86$501,733.86Apron Pavement4.08 Shape and compact existing sub-gradem2 1,685 $ 7.50 $ 12,637.50$12,637.504.09 Supply, place and compact 180mm sandm2 1,685 $ 14.40 $ 24,264.00 $ 16,984.80 $7,279.204.10 Supply, place and compact 330mm PM2/20 QRm2 1,685 $ 33.00 $ 55,605.00 $ 38,923.50 $16,681.504.11 Profiling of Existing Seal - Disposal on sitem2 20,805 $ 12.00$ 249,660.00$249,660.004.12 Supply, place and compact 150mm PM1/20m2 22,490 $ 15.00 $ 337,350.00 $ 236,145.00 $101,205.004.13 Supply and place 2 coats of 10/7 spray seal (including Prime Coat)m2 22,490 $ 12.73 $ 286,297.70$286,297.704.14 Supply and place spray sealed pavement from baggage collection area to apronAssumed 150mm of Rubble, 150mm of base course m2 125 $ 50.78 $ 6,347.50$6,347.50and 10/7 spray seal4.15 Supply and Place Sand Emulsion Coatm2 22,490 $ 6.37 $ 143,148.85$143,148.8515m Runway Extension4.14 Supply, place and compact 150mm sandm2 900 $ 12.00 $ 10,800.00 $ 7,560.00 $3,240.004.15 Supply, place and compact 150mm PM1/20m2 900 $ 15.00 $ 13,500.00 $ 9,450.00 $4,050.004.16 Supply and place 2 coats of 10/7 spray seal (including Prime Coat)m2 900 $ 12.73 $ 11,457.00 $ 8,019.90 $3,437.104.15 Supply and Place Sand Emulsion Coatm2 900 $ 6.37 $ 5,728.50 $ 4,009.95 $1,718.554.17 Linemarkingitem 1 $ 82,500.00 $ 82,500.00$82,500.004.18 Relocation of Helicopter Parking Areaitem 1 $ 5,000.00 $ 5,000.00$5,000.00Sub-Total$ 5,850,283.82 $ 1,900,900.89 $ 3,949,382.935.0 Lighting5.01 Supply and Install new runway marker lightsassumed lighting on figures indicative of actual lighting each 22 $ 5,000.00 $ 110,000.00$110,000.00requirements5.02 Relocation of existing runway marker lightseach 29 $ 3,500.00 $ 101,500.00$101,500.005.03 Relocation of existing apron and taxiway A marker lightseach 26 $ 3,500.00 $ 91,000.00$91,000.005.04 Relocation of end of runway threshold lightseach 16 $ 4,800.00 $ 76,800.00$76,800.005.05 Supply and Install new Precision Approach Path Indicator (PAPI)item 1 $ 150,000.00 $ 150,000.00$150,000.005.06 Apron lightingItem 1 $ 15,000.00 $ 15,000.00$15,000.00Sub-Total$ 544,300.00 $ - $544,300.006.0 Building6.01 Building ConstructionIncludes substructure, superstructure, internal fitout, m2 1089 $ 3,000.00 $ 3,267,000.00 $ 163,350.00 $ 3,103,650.00fencing relocation6.02 Security EquipmentItem 1 $ 1,000,000.00 $ 1,000,000.00$ 1,000,000.006.03 Supply and Install Septic Systemitem 1 $ 55,125.00$ 55,125.00$55,125.006.04 Relocation of ServicesItem 1 $ 20,000.00 $ 20,000.00$20,000.006.05 Upgrade of refueling facilityitem 1 $ 150,000.00 $ 150,000.00$150,000.00Sub-Total$ 4,492,125.00 $ 163,350.00 $ 4,328,775.007.0 Design Fees7.01 Detailed Design Fees5% of construction fees Item 1 $ 600,000.00 $ 600,000.00$600,000.00Sub-Total$ 600,000.00 $ - $600,000.00TOTAL CIVIL WORKS (EX GST)CONTINGENCIESTOTAL CIVIL WORKS inc. CONTINGENCIES (EX GST)GST (10%)CITB (0.25%)GRAND TOTAL(inc GST & CONTINGENCY)$ 13,452,685.05 $ 2,286,072.64 $ 11,166,612.4112.5% $ 1,681,585.63 $ 285,759.08 $ 1,395,826.55$ 15,134,270.69 $ 2,571,831.72 $ 12,562,438.97$ 1,513,427.07 $ 257,183.17 $ 1,256,243.90$ 41,619.24 $ 7,072.54 $34,546.71$ 16,689,317.00 $ 2,836,087.43 $ 13,853,229.57Note:Note:Note:Note:This is a preliminary cost estimate and has been prepared based on information provided to Tonkin Consulting and upon experience and historical unit rates. Tonkin Consulting takes no responsibility for any variations- Latent conditions- Changes in scope- Market conditions (i.e. competition, escalation)- No allowance for site contamination and remediation- No allowance for Rock excavation- No allowance has been made for the staging of these works- No allowance has been made for landscaping or revegetation- Assumed that items supplied from mainland but installed by local contractors will be assigned a ration of 20% KI to 80% mainlandThe following items included in the estimate are provisional only:-- Earthworks quantities- Road areasTonkin Consulting recommend that a professional Quantity Surveyor be engaged if assurance of cost is required and project budget estimates allowing for these factors are required.Rates adjusted for <strong>Kingscote</strong> Regional Indices
<strong>Kingscote</strong> Airfield Review<strong>Kangaroo</strong> <strong>Island</strong> CouncilConstruction Cost Estimate for Option 4, Boeing 737Revision:BJob No. 2010.1278Estimated: TG/MDS26-Oct-12Reviewed: BEMItem DescriptionComment/Assumptions Unit Quantity Rate Total Cost - KI Cost - Mainland1.0 Preliminaries1.01 EstablishmentItem 1 $ 500,000.00 $ 500,000.00 $ 50,000.00 $ 450,000.001.02 Demobilisation (including clean up)Item 1 $ 325,000.00 $ 350,000.00 $ 35,000.00 $ 315,000.001.03 Administration, PMP, EMP, QMS, OHSItem 1 $ 300,000.00 $ 275,000.00 $ 27,500.00 $ 247,500.001.04 Engineering - Setting out/SurveyItem 1 $ 50,000.00 $ 50,000.00 $ 45,000.00 $5,000.001.05 Testing (as specified)Item 1 $ 150,000.00 $ 150,000.00 $ 15,000.00 $ 135,000.001.06 Service locationItem 1 $ 25,000.00 $ 25,000.00 $ 22,500.00 $2,500.001.07 Insurances: Construction work & Public LiabilityItem 1 $ 100,000.00 $ 100,000.00 $ 10,000.00 $90,000.001.08 Silt ControlItem 1 $ 40,000.00 $ 40,000.00 $ 4,000.00 $36,000.001.09 Traffic ControlItem 1 $ 150,000.00 $ 150,000.00 $ 15,000.00 $ 135,000.001.10 Tree clearing/trimming in flight pathItem 1 $ 50,000.00 $ 50,000.00 $ 50,000.001.11 As-Constructed SurveysItem 1 $ 75,000.00 $ 75,000.00 $ 67,500.00 $7,500.001.12 Accommodation and allowancesItem 1 $ 250,000.00 $ 250,000.00$ 250,000.00Sub-Total$ 2,015,000.00 $ 341,500.00 $ 1,673,500.002.0 Site Preparation and Earthworks2.01 Strip top soil (100mm), stockpile, and respread on completed battersApplicable to all areas of earthworks m2 72168 $ 7.88 $ 568,323.00$ 568,323.002.02 Excavate material for runway extension and widening (500mm), stockpile on sitem3 36084 $ 7.20 $ 259,804.80$ 259,804.802.03 Place and compact stockpiled fill adjacent runwayTo match new runway level, grade at max 2.5% m3 25500 $ 9.30 $ 237,150.00$ 237,150.002.04 Place and compact imported fill adjacent runwayTo match new runway level, grade at max 2.5% $ 37.50 $-Sub-Total$ 1,065,277.80 $ - $ 1,065,277.803.0 Stormwater3.01 Supply and construct protective concrete slab above existing 600mm RCP2000mm wide, 300mm thick, 20,000mm long 25 MPaconcrete slab3.02 Supply and construct protective concrete slab above existing 675mm RCP underneath Apron 2000mm wide, 300mm thick, 280m long 25 MpaSealReinforced concrete slab. Assumed pipe will requireprotection. Check can be done to determine if structuralloading will exceed pipe capacity at later stage.m3 12 $ 337.50 $ 4,050.00$4,050.00m3 168 $ 337.50 $ 56,700.00$56,700.003.03 Pit adjustments of 675mm RCP underneath Apron SealClass D - V grates and concrete surround. Supply and each 3 $ 2,079.00 $ 6,237.00$6,237.00install.3.04 Infill existing 300mm RCP with controlled low strength materialFlowable Self levelling cementitious material - Rawlinsons m3 53.0 $ 210.00 $ 11,133.02$11,133.0220123.05 Supply and lay DN 1350 RCP at intersection of south perimeter O.U.D and runwaylin m 150 $ 3,300.00 $ 495,000.00$ 495,000.003.06 Supply and install DN1350 precast concrete headwallseach 2 $ 2,200.00 $ 4,400.00$4,400.003.07 Supply and Install Humeceptor Gross Pollutant TrapItem 1 $ 56,592.00 $ 56,592.00$56,592.00Sub-Total$ 634,112.02 $ - $ 634,112.024.0 PavementsRunway Pavement4.01 Shape and compact existing sub-gradem2 72,168 $ 7.50 $ 541,260.00$ 541,260.004.02 Supply, place and compact 230mm sandm2 72,168 $ 18.40 $ 1,327,891.20 $ 929,523.84 $ 398,367.364.03 Supply, place and compact 270mm PM2/20 QRm2 72,168 $ 27.00 $ 1,948,536.00 $ 1,363,975.20 $ 584,560.804.04 Supply, place and compact 300mm PM1/20m2 72,168 $ 30.00 $ 2,165,040.00 $ 1,515,528.00 $ 649,512.004.05 Profiling of Existing Seal - Disposal on sitem2 56,159 $ 12.00 $ 673,908.00$ 673,908.004.06 Supply, place and compact 300mm PM1/20 overlay on existing pavementm2 56,159 $ 30.00 $ 1,684,770.00 $ 1,179,339.00 $ 505,431.004.07 Supply and place 40mm AC14 hotmix asphaltm2 128,327 $ 30.59 $ 3,926,067.03$ 3,926,067.03Apron Pavement4.08 Shape and compact existing sub-gradem2 4,200 $ 7.50 $ 31,500.00$31,500.004.09 Supply, place and compact 230mm sandm2 4,200 $ 18.40 $ 77,280.00 $ 54,096.00 $23,184.004.10 Supply, place and compact 270mm PM2/20 QRm2 4,200 $ 27.00$ 113,400.00$ 79,380.00$34,020.004.11 Supply, place and compact 300mm PM1/20m2 4,200 $ 30.00 $ 126,000.00 $ 88,200.00 $37,800.004.12 Profiling of Existing Seal - Disposal on sitem2 20,805 $ 12.00 $ 249,660.00$ 249,660.004.13 Supply, place and compact 300mm PM1/20 overlay on existing pavementm2 20,805 $ 30.00 $ 624,150.00 $ 436,905.00 $ 187,245.004.14 Supply and place 40mm AC14 hotmix asphaltm2 25,005 $ 30.59 $ 765,008.97$ 765,008.974.15 Supply and place spray sealed pavement from baggage collection area to apronAssumed 150mm of Rubble, 150mm of base course and m2 125 $ 50.78 $ 6,347.50$6,347.5010/7 spray seal15m Runway Extension4.16 Supply, place and compact 150mm sandm2 900 $ 12.00 $ 10,800.00 $ 7,560.00 $3,240.004.17 Supply, place and compact 150mm PM1/20m2 900 $ 15.00 $ 13,500.00 $ 9,450.00 $4,050.004.18 Supply and place 40mm AC14 hotmix asphaltm2 900 $ 30.59 $ 27,534.82$27,534.824.19 Grooving asphalt (extra grip)m2 128,327 $ 12.00 $ 1,539,924.00$ 1,539,924.004.20 Linemarkingitem 1 $ 99,000.00 $ 99,000.00$99,000.004.21 Relocation of Helicopter Parking Areaitem 1 $ 5,000.00 $ 5,000.00$5,000.00Sub-Total$ 15,956,577.52 $ 5,663,957.04 $ 10,292,620.485.0 Lighting5.01 Supply and Install new runway marker lightsassumed lighting on figures indicative of actual lighting each 30 $ 5,000.00 $ 150,000.00$ 150,000.00requirements5.02 Relocation of existing runway marker lightseach 29 $ 3,500.00 $ 101,500.00$ 101,500.005.03 Relocation of existing apron and taxiway A marker lightseach 26 $ 3,500.00 $ 91,000.00$91,000.005.04 Relocation of end of runway threshold lightseach 16 $ 4,800.00 $ 76,800.00$76,800.005.05 Supply and Install new Precision Approach Path Indicator (PAPI)Item 1 $ 150,000.00 $ 150,000.00$ 150,000.005.06 Apron lightingItem 1 $ 15,000.00 $ 15,000.00$15,000.00Sub-Total$ 584,300.00 $ - $ 584,300.006.0 Building6.01 Building ConstructionIncludes substructure, superstructure, internal fitout, m2 1886 $ 4,000.00 $ 7,544,000.00 $ 377,200.00 $ 7,166,800.00fencing relocation6.02 Security equipmentitem 1 $ 1,000,000.00 $ 1,000,000.00$ 1,000,000.006.03 Supply and Install Septic Systemitem 1 $ 90,000.00$ 90,000.00$90,000.006.04 Relocation of ServicesItem 1 $ 20,000.00 $ 20,000.00$20,000.006.05 Upgrade of refueling facilityitem 1 $ 150,000.00 $ 150,000.00$ 150,000.00Sub-Total$ 8,804,000.00 $ 377,200.00 $ 8,426,800.007.0 Design Fees7.01 Detailed Design Fees5% of construction fees Item 1 $ 1,450,000.00 $ 1,450,000.00$ 1,450,000.00Sub-Total$ 1,450,000.00 $ - $ 1,450,000.00TOTAL CIVIL WORKS (EX GST)CONTINGENCIESTOTAL CIVIL WORKS inc. CONTINGENCIES (EX GST)GST (10%)CITB (0.25%)GRAND TOTAL(inc GST & CONTINGENCY)$ 29,924,967.34 $ 6,382,657.04 $ 24,126,610.3012.5% $ 3,740,620.92 $ 797,832.13 $ 3,015,826.29$ 33,665,588.25 $ 7,180,489.17 $ 27,142,436.58$ 3,366,558.83 $ 718,048.92 $ 2,714,243.66$ 92,580.37 $ 19,746.35 $74,641.70$ 37,124,727.45 $ 7,918,284.43 $ 29,931,321.94Note:Note:Note:Note:This is a preliminary cost estimate and has been prepared based on information provided to Tonkin Consulting and upon experience and historical unit rates. Tonkin Consulting takes no responsibility for any variations- Latent conditions- Changes in scope- Market conditions (i.e. competition, escalation)- No allowance for site contamination and remediation- No allowance for Rock excavation- No allowance has been made for the staging of these works- No allowance has been made for landscaping or revegetation- Assumed that items supplied from mainland but installed by local contractors will be assigned a ration of 20% KI to 80% mainlandThe following items included in the estimate are provisional only:-- Earthworks quantities- Road areasTonkin Consulting recommend that a professional Quantity Surveyor be engaged if assurance of cost is required and project budget estimates allowing for these factors are required.Rates adjusted for <strong>Kingscote</strong> Regional Indices
<strong>Kangaroo</strong> <strong>Island</strong> <strong>Airport</strong> Upgrade <strong>Business</strong> <strong>Case</strong> - <strong>Appendices</strong>CAppendix - EconSearch ReportMay 2013
Impact of Agriculture andTourism Industries on the<strong>Kangaroo</strong> <strong>Island</strong> EconomyA report to<strong>Kangaroo</strong> <strong>Island</strong> Futures AuthorityPrepared by9 April 2013EconSearch Pty Ltd214 Kensington RoadMarryatville SA 5068Tel: (08) 8431 5533Fax: (08) 8431 7710www.econsearch.com.au
CONTENTSContents ........................................................................................................................................ iiTables ............................................................................................................................................ivFigures ...........................................................................................................................................ivAbbreviations ................................................................................................................................ vDocument History and Status ....................................................................................................... vExecutive Summary .......................................................................................................................vi1. Introduction ........................................................................................................................ 12. Method ............................................................................................................................... 32.1 Method of Analysis ................................................................................................... 32.2 I-O Model Construction ............................................................................................ 32.3 Indicators of Economic Impact ................................................................................. 63. Review and Consultation .................................................................................................... 83.1 Aim of the Consultation Process .............................................................................. 83.2 Review of Policy, Planning and Program Documents ............................................... 83.3 Growth Limiters ........................................................................................................ 94. Profile of Economic Activity on <strong>Kangaroo</strong> <strong>Island</strong> .............................................................. 124.1 <strong>Kangaroo</strong> <strong>Island</strong> Economy in 2011/12 .................................................................... 124.2 <strong>Kangaroo</strong> <strong>Island</strong> Economy: Recent Trends ............................................................. 145. Economic Contribution of Tourism ................................................................................... 165.1 Visitor Numbers and Tourism Expenditure ............................................................ 165.2 Economic Contribution of Tourism ......................................................................... 176. Economic Contribution of Agriculture .............................................................................. 196.1 Area and Value of Production................................................................................. 196.2 Economic Contribution of Agriculture .................................................................... 217. Pathways to Growth ......................................................................................................... 257.1 Tourism ................................................................................................................... 257.1.1 <strong>Kingscote</strong> <strong>Airport</strong> upgrade ........................................................................... 257.1.2 Drivers of tourism growth ............................................................................ 307.1.3 Economic contribution of tourism - low growth scenario ........................... 337.1.4 Economic contribution of tourism - moderate scenario .............................. 347.1.5 Economic contribution of tourism – high growth scenario .......................... 367.1.6 Summary ...................................................................................................... 377.2 Agriculture .............................................................................................................. 377.2.1 Drivers of agricultural industry growth ........................................................ 377.2.2 Economic contribution of agriculture – low growth scenario ...................... 387.2.3 Economic contribution of agriculture – moderate growth scenario ............ 397.2.4 Economic contribution of agriculture – high growth scenario ..................... 407.2.5 Summary ...................................................................................................... 41
<strong>Kangaroo</strong> <strong>Island</strong> Futures Authority Draft Economic Impact of Agriculture and TourismReferences ................................................................................................................................... 43Appendix 1 Intermediate Sector Specification ....................................................................... 45Appendix 2 An Overview of Economic Impact Analysis using the Input-Output Method ..... 50Appendix 3 Glossary of Input-Output Terminology ............................................................... 60Appendix 4 List of Policy and Planning Documents ............................................................... 62Appendix 5 Tourism Markets and their Potential for Growth ............................................... 64Appendix 6 Summary of Key Growth Opportunities Raised during Consultation ................. 68Appendix 7 Stakeholders Consulted ...................................................................................... 73Appendix 8 Notes for Consultation ....................................................................................... 741. Introduction ...................................................................................................................... 76Aim 76Previous studies, plans and research ................................................................................ 762. Key Growth Limiters.......................................................................................................... 78Growth Limiters - General ................................................................................................ 78Growth Limiters – Tourism Focus ..................................................................................... 79Growth Limiters – Agriculture Focus ................................................................................ 793. Tourism Scenarios ............................................................................................................. 80Base case ........................................................................................................................... 80Moderate growth .............................................................................................................. 81Other scenarios ................................................................................................................. 814. Agriculture Scenarios ........................................................................................................ 82Base case ........................................................................................................................... 82Moderate growth .............................................................................................................. 82Other scenarios ................................................................................................................. 825. Thought Starters ............................................................................................................... 83Appendix 9 Expenditure on Transport Services on <strong>Kangaroo</strong> <strong>Island</strong> .................................... 84e c o n s e a r c hPage| iii
<strong>Kangaroo</strong> <strong>Island</strong> Futures Authority Draft Economic Impact of Agriculture and TourismTABLESTable 2.1 Steps undertaken to estimate total tourism sales to final demand for<strong>Kangaroo</strong> <strong>Island</strong>, 2011/12 ........................................................................................ 5Table 4.1 Employment and output, <strong>Kangaroo</strong> <strong>Island</strong>, 2011/12 ............................................ 12Table 4.2 Household income, other value added and gross regional product,<strong>Kangaroo</strong> <strong>Island</strong>, 2011/12 a .................................................................................... 13Table 5.1 Visitor expenditure on <strong>Kangaroo</strong> <strong>Island</strong>, 2011/12 ................................................. 16Table 5.2 The contribution of tourism to GRP and employment on <strong>Kangaroo</strong><strong>Island</strong>, 2011/12 ...................................................................................................... 18Table 6.1 Area of agricultural production, <strong>Kangaroo</strong> <strong>Island</strong>, 2006 and 2011 ....................... 19Table 6.2 Area planted to winegrapes, <strong>Kangaroo</strong> <strong>Island</strong>, 2011/12 ....................................... 20Table 6.3 Value of agricultural production on <strong>Kangaroo</strong> <strong>Island</strong>, 2001, 2006, 2011(nominal dollars) .................................................................................................... 21Table 6.4 Direct impact of agricultural production (adjusted), 2011 (nominaldollars) ................................................................................................................... 22Table 6.5 Economic contribution of the agriculture value chain to the <strong>Kangaroo</strong><strong>Island</strong> economy in 2011/12 a ................................................................................. 23Table 7.1 <strong>Kingscote</strong> <strong>Airport</strong> upgrade construction expenditure a ......................................... 26Table 7.2 Economic Impact of the <strong>Kingscote</strong> <strong>Airport</strong> upgrade options, constructionphase ..................................................................................................................... 27Table 7.3 <strong>Kingscote</strong> <strong>Airport</strong> upgrade annual operating and maintenanceexpenditure ........................................................................................................... 28Table 7.4 Economic Impact of the <strong>Kingscote</strong> <strong>Airport</strong> upgrade options, operationphase ..................................................................................................................... 29Table 7.5 Summary of the tourism low, moderate and high growth scenarios .................... 31Table 7.6 Economic impact of tourism expenditure growth: low growth scenario .............. 34Table 7.7 Economic impact of tourism expenditure growth: moderate growthscenario ................................................................................................................. 35Table 7.8 Economic impact of tourism expenditure growth: high growth scenario............. 36Table 7.9 Drivers of economic growth: 8 years to 2019/20 .................................................. 38Table 7.10 Agricultural impact: low growth scenario, 8 years to 2019/20 ............................. 39Table 7.11 Agricultural impact: moderate growth scenario, 8 years to 2019/20 ................... 40Table 7.12 Agricultural impact: high growth scenario, 8 years to 2019/20 ............................ 41FIGURESFigure 4-1 Employment rate of growth: <strong>Kangaroo</strong> <strong>Island</strong> and South Australia ...................... 14Figure 4-2 Gross regional product rate of growth: <strong>Kangaroo</strong> <strong>Island</strong> and SouthAustralia ................................................................................................................. 15Figure 5-1 Number of visitors on <strong>Kangaroo</strong> <strong>Island</strong>, 2011/12 .................................................. 17Figure 5-2 Visitor expenditure on <strong>Kangaroo</strong> <strong>Island</strong>, 2011/12 ................................................. 17e c o n s e a r c hPage| iv
<strong>Kangaroo</strong> <strong>Island</strong> Futures Authority Draft Economic Impact of Agriculture and TourismABBREVIATIONSABS Australian Bureau of Statisticsfte full time equivalentGRP gross regional productGSP gross state productKI <strong>Kangaroo</strong> <strong>Island</strong>KIFA <strong>Kangaroo</strong> <strong>Island</strong> Futures AuthorityRISE Regional Industry Structure and EmploymentSA South AustraliaSASP South Australian Strategic PlanSATC South Australian Tourism CommissionTRA Tourism Research AustraliaDOCUMENT HISTORY AND STATUSDoc VerDocStatusIssued ToQtyelecQtyhardDate Reviewed Approved1 Draft Kristina Roberts 1 - 3/12/12 JBM JBM2 Draft Kristina Roberts 1 - 26/02/13 JBM JBM3 Draft Kristina Roberts 1 - 28/03/13 BG JBM4 Draft Kristina Roberts 1 - 9/04/13 JBM JBMPrinted:Last Saved:File Name:Project Manager:Principal Author/s:Name of Client:16/05/2013 3:58:00 PM16/05/2013 11:17:00 AMC:\Users\jmickan\Desktop\EconSearch report.docxJulian MorisonJulian Morison, Bob Goreing and Lisa Rippin<strong>Kangaroo</strong> <strong>Island</strong> Futures AuthorityName of Project: Impact of Agriculture and Tourism Industries on the <strong>Kangaroo</strong> <strong>Island</strong>EconomyDocument Version: 4Job Number: 1236e c o n s e a r c hPage| v
<strong>Kangaroo</strong> <strong>Island</strong> Futures Authority Draft Economic Impact of Agriculture and TourismIntroductionEXECUTIVE SUMMARYThe economy of <strong>Kangaroo</strong> <strong>Island</strong> is largely based on agriculture, tourism and, to a lesserextent, fishing. These key economic drivers are supported by a range of service industries,particularly in the areas of services to agriculture, accommodation and business services.Current ContributionThe <strong>Island</strong>’s economic base is expanding with the potential for increased tourism beingrecognised and with new industries being targeted, including horticulture, aquaculture andsustainable development (e.g. renewable energy, wind farms).Future Growth ScenariosThis study has undertaken economic impact modelling and scenario analysis for both thetourism and agricultural industries on <strong>Kangaroo</strong> <strong>Island</strong>. The impact analysis takes account ofthe implications of economic development for population growth and the related effect on thehealth, education and other service sectors.Economic impact modelling has been prepared for low, moderate and high growth scenarios intourism and agriculture over an 8 year period, from the baseline year of 2011/12 to 2019/20.A desk top study of planning and policy documents provided an indication of the level ofalignment with key government and industry priorities, and targeted stakeholder consultationprovided a confirmation that growth targets were realistic.Industry growth was seen to span three time frames: short term (0-4 years), middle term (5-9years) and longer term (10 years plus).Tourism sector growth at rates equivalent to trend or better were seen by stakeholders aspossible in the short term with limited major investment required. Growth was seen initially tobe driven by innovation (technology, management and marketing) and the take up of sparecapacity in infrastructure and service provision.Growth for tourism in the middle to longer term was focused on new market development,particularly in domestic overnight stay and international markets. This growth would befacilitated by major milestone investment such as an upgrade of <strong>Kingscote</strong> <strong>Airport</strong>,development of new tourism experiences and accommodation and an upgrade to utilities suchas power and water supply.Potential growth in the agriculture sector was based on four main drivers: increase inproduction (productivity), reduced costs (logistics), Branding premium and change in land use(horticulture and other agriculture).Short – medium term growth drivers for agriculture are based on innovation, for example arise in productivity due to use of technology and management, as well as marketing anddeveloping brand premiums. Middle to longer term growth, like tourism growth, appeared torely on major milestone investment in infrastructure like bulk handling or value addingfacilities or the knock on effect of reduced costs as a result of improvements to thedevelopment of access arrangements.e c o n s e a r c hPage| vi
<strong>Kangaroo</strong> <strong>Island</strong> Futures Authority Draft Economic Impact of Agriculture and TourismLow growth scenariosThe low growth scenario for the tourism and agricultural industries would deliver 2.6 per centgrowth over 8 years in both industries. For tourism it includes continuing to develop successfulinitiatives in marketing, increased adoption of technology and skilling in e commerce andgrowing efficiencies in the utilisation of existing infrastructure capacity amongst otherstrategies. Milestone development aimed at building capacity in transport (access) and thesupply of utilities will also be required. This study considers the potential in upgrading the<strong>Kingscote</strong> <strong>Airport</strong> in the short to middle term as a partial response to meeting this need..For agriculture the low growth scenario requires a combination of low level improvement inthe four main potential drivers of economic growth, namely technical productivity (e.g.yield/hectare), operating costs (e.g. logistics), premium brand (e.g. Brand <strong>Kangaroo</strong> <strong>Island</strong>) andchange in land use (e.g. switch to more intensive production systems).Across both industries this growth would see an increase in <strong>Kangaroo</strong> <strong>Island</strong> gross regionalproduct (GRP) of about 10 per cent and full-time equivalent (fte) jobs growth of around 9 percent.Table ES1Economic impact of tourism and agriculture growth: low growth scenarioGross Regional ProductEmploymentRate of growth a(%/an)Increase by2019/20 ($m)Impact on KI b(%)Increase by2019/20 (fte)Impact on KI c(%)Tourism 2.6% 12.2 5.6% 107 4.6%Agriculture 2.6% 9.8 4.5% 103 4.4%Total - 22.0 10.1% 209 9.0%abcFor tourism it is the annual rate of growth of visitor expenditure and for agriculture it is the annual rate ofgrowth of farm gate gross value of production.KI gross regional product estimated to be $217 million in 2011/12 (<strong>Kangaroo</strong> <strong>Island</strong> RISE model).KI employment estimated to be 2,330 fte in 2011/12 (<strong>Kangaroo</strong> <strong>Island</strong> RISE model).Moderate growth scenariosThe moderate growth scenario for tourism and agriculture industries would deliver annualaverage growth over eight years of 4.9 per cent and 4.5 per cent, respectively. The need formilestone developments becomes more critical for this scenario as greater pressure is placedon infrastructure for example. As previously stated, this study considers the potential inupgrading the <strong>Kingscote</strong> <strong>Airport</strong> in the short to middle term to illustrate this point.For tourism, this is the rate of growth that is required to meet the target of $180m of visitorexpenditure set in South Australia’s Strategic Plan (SASP).Across both industries this growth would see an increase in <strong>Kangaroo</strong> <strong>Island</strong> GRP of almost 22per cent and fte jobs growth of around 17 per cent.e c o n s e a r c hPage| vii
<strong>Kangaroo</strong> <strong>Island</strong> Futures Authority Draft Economic Impact of Agriculture and TourismTable ES2Economic impact of tourism and agriculture growth: moderate growth scenarioGross Regional ProductEmploymentRate of growth a(%/an)Increase by2019/20 ($m)Impact on KI b(%)Increase by2019/20 (fte)Impact on KI c(%)Tourism 4.9% 24.4 11.3% 213 9.2%Agriculture 4.5% 22.3 10.3% 181 7.8%Total - 46.8 21.6% 395 16.9%abcFor tourism it is the annual rate of growth of visitor expenditure and for agriculture it is the annual rate ofgrowth of farm gate gross value of production.KI gross regional product estimated to be $217 million in 2011/12 (<strong>Kangaroo</strong> <strong>Island</strong> RISE model).KI employment estimated to be 2,330 fte in 2011/12 (<strong>Kangaroo</strong> <strong>Island</strong> RISE model).High growth scenariosThe high growth scenario for the tourism and agricultural industries would deliver 7.9 per centgrowth over eight years in both industries. For both tourism and agriculture this level ofgrowth (83 per cent over the 8-year period) could be considered in line with the SA EconomicDevelopment Board’s target of doubling visitor expenditure and farm gate value of productionover the 8-year period.The aggregate impact of this growth would be an increase in the GRP of almost 40 per cent(above the 2011/12 level) and fte jobs growth of just under 29 per cent.Table ES3Economic impact of tourism and agriculture growth: moderate growth scenarioRate of growth a(%/an)Increase by2019/20 ($m)Impact on KI b(%)Increase by2019/20 (fte)Impact on KI c(%)Tourism 7.9% 49.4 22.8% 383 16.4%Agriculture 7.9% 36.6 16.9% 288 12.4%Total - 86.0 39.6% 671 28.8%abcFor tourism it is the annual rate of growth of visitor expenditure and for agriculture it is the annual rate ofgrowth of farm gate gross value of production.KI gross regional product estimated to be $217 million in 2011/12 (<strong>Kangaroo</strong> <strong>Island</strong> RISE model).KI employment estimated to be 2,330 fte in 2011/12 (<strong>Kangaroo</strong> <strong>Island</strong> RISE model).Realistic targetsGross Regional ProductEmploymentThe apparent level of alignment with policy and program priorities of key government agenciesand industry bodies along with the views expressed by the key stakeholders consulted suggestthat the targets outlined in this study may be realistic with a clear recognition of the need forplanning, development and implementation commitment from a range of stakeholders.Achieving the growth scenarios relies on delivering innovation such as technology andmanagement practice, concerted marketing effort, appropriate land use planning, investmentin milestone infrastructure development and the support of the broader community amongstother factors.By their nature the higher targets are more difficult to achieve given the need for integratedand timely milestone development and for a higher level of effectiveness in programs such asthe tourism ‘stay one more day’ program identified in the high growth tourism target.e c o n s e a r c hPage| viii
<strong>Kangaroo</strong> <strong>Island</strong> Futures Authority Draft Economic Impact of Agriculture and TourismSide issues such as managing the substantive residential population growth necessary tosupport the increased economic activity have not been addressed in this study but clearly theybecome more significant as the targets become more ambitious.e c o n s e a r c hPage| ix
<strong>Kangaroo</strong> <strong>Island</strong> Futures Authority Draft Economic Impact of Agriculture and Tourism1. INTRODUCTIONThe economy of <strong>Kangaroo</strong> <strong>Island</strong> is largely based on agriculture, tourism and, to a lesserextent, fishing. These key economic drivers are supported by a range of service industries,particularly in the areas of services to agriculture, accommodation and business services. Thefour main towns on the <strong>Island</strong>, <strong>Kingscote</strong>, Penneshaw, American River and Parndana, provideretail, commercial and community services for an estimated population of 4,675 (ABS 2012a).Regional population has grown slowly since the 1970s and continues to grow but at a rate ofless than 1 per cent per year. The labour force participation rate on <strong>Kangaroo</strong> <strong>Island</strong>, at around70 per cent (derived from ABS 2012b and DEEWR 2012), is well above the South Australian(SA) and rural SA averages and among the highest in the state. The unemployment rate for theSeptember Quarter 2012 was 3.8 per cent (DEEWR 2012), well below the state average (5.4per cent).The <strong>Island</strong>’s economic base is expanding with the potential for increased tourism beingrecognised and with new industries being targeted, including horticulture, aquaculture andsustainable development (e.g. renewable energy, wind farms).EconSearch was engaged by <strong>Kangaroo</strong> <strong>Island</strong> Futures Authority (KIFA) to consider economicimpact modelling and scenario implications for both tourism and agriculture on <strong>Kangaroo</strong><strong>Island</strong>. The impact analysis takes account of the implications of economic development forpopulation growth and the related effect on the health, education and other service sectors.The study of the impact of the tourism and agriculture industries on the <strong>Kangaroo</strong> <strong>Island</strong>economy involves the development of various scenarios for analysis using the RegionalIndustry Structure and Employment (RISE) economic impact model. The method used toundertake the economic impact analysis is described in Section 2 of this report.Scenarios for tourism and agriculture were developed separately. It was considered importantto justify the scenarios and the targets for growth as ‘realistic’. Section 3 of this report containsa discussion in three parts:1. the objectives of the consultation process (Section 3.1);2. a review of policy, planning and program documents (Section 3.2); and3. growth limiters (Section 3.3).A desk top study of planning and policy documents provided an indication of the level ofalignment with key government and industry priorities, and targeted stakeholder consultationprovided insight into whether the growth targets were seen as realistic by stakeholders. It wasnoted that many of the strategic planning documents considered had themselves been thesubject of comprehensive community engagement. This was important as a measure of thepotential for community support for growth which is seen as an important factor in the successof future plans to meet the targets identified.The remainder of the report is dedicated to the economic impact analysis, including:• a profile of economic activity on <strong>Kangaroo</strong> <strong>Island</strong> (Section 4);e c o n s e a r c hPage| 1
<strong>Kangaroo</strong> <strong>Island</strong> Futures Authority Draft Economic Impact of Agriculture and Tourism• the economic contribution of tourism and agriculture, respectively (Sections 5 and 6);and• pathways to growth, including the analysis of three growth scenarios for both thetourism and agricultural sectors (Section 7).e c o n s e a r c hPage| 2
<strong>Kangaroo</strong> <strong>Island</strong> Futures Authority Draft Economic Impact of Agriculture and Tourism2. METHOD2.1 Method of AnalysisThe estimates of economic impact presented in this report were based on the use of the inputoutput(I-O) method. I-O analysis provides a comprehensive economic framework that is usefulin the resource planning process. The I-O method forms the analytical core of the economicimpact model for <strong>Kangaroo</strong> <strong>Island</strong>, namely the RISE model 1 . Broadly, there are two ways inwhich the I-O method can be used.First, the I-O transactions table provides a numerical picture of the size and shape of theeconomy and its essential features. It can be used to describe some of the important featuresof an economy, the interrelationships between sectors and the relative importance of theindividual sectors.Second, I-O analysis provides a standard approach for the estimation of the economic impactof a particular activity. The I-O model is used to calculate industry multipliers that can then beused to estimate the economic impacts arising from some change in the local economy or theeconomic contribution of an existing industry.2.2 I-O Model ConstructionThe one local government area (LGA) that comprises the region is <strong>Kangaroo</strong> <strong>Island</strong> (C).For the purpose of estimating the local economic impacts of agriculture and tourism on<strong>Kangaroo</strong> <strong>Island</strong>, economic impact models for <strong>Kangaroo</strong> <strong>Island</strong> and the State of South Australiawere constructed by the consultants for 2011/12. The data sources and method used toconstruct this model are detailed below.Standard I-O models for the above local and regional areas for 2011/12 were developed usingthe GRIT (Generation of Regional Input-Output Tables) method, a ‘hybrid’ method whichutilises local/regional data and computer methods to generate I-O tables. Whilst the majorityof data compilation and manipulation was undertaken in Microsoft Excel® spreadsheets, thefirst stage of the GRIT procedure (based on the use of output-based location quotients) wasundertaken using IO9 software (West 2009). The ‘parent’ table for the KANGAROO ISLAND I-Omodel was an I-O table for South Australia for 2011/12.An important characteristic of GRIT-produced I-O tables relates to their accuracy. Afundamental principle of the GRIT method is that not all cells in the table are equallyimportant. Some will not be important because they are very small values and, therefore, haveno possibility of generating inaccurate estimates of multipliers and economic impacts. Otherswill not be important because of the lack of linkages that relate to the particular sectors thatare being studied.1Regional Industry Structure and Employment (RISE) model.e c o n s e a r c hPage| 3
<strong>Kangaroo</strong> <strong>Island</strong> Futures Authority Draft Economic Impact of Agriculture and TourismThe GRIT method involves determining those sectors and, in some cases, cells that are ofparticular significance for the analysis. Research resources are targeted to data gathering inthese areas. For the remainder of the table, the aim is for it to be 'holistically' accurate (Jensen1980). That means the table provides a generally accurate representation of the economy, butdoes not guarantee the accuracy of any particular cell.Sources of data for the regional I-O model included:• Australian Bureau of Statistics (ABS)oooooo2011 Census of Population and Housing (ABS 2012c);Australian National Accounts, 2011/12 State Accounts (ABS 2012d);Australian National Accounts, Input-Output Tables - Electronic Publication2008/09 (ABS 2012e)2011 Agricultural Census (ABS 2012f) and AgStats data for 2010/11 (ABS2012g);2009/10 Household Expenditure Survey (ABS 2011a);Regional Population Growth, Australia (ABS 2012a);• Department of Employment and Workplace Relations (DEWR 2012); and• Australian Taxation Office (ATO 2012).Based on work undertaken by Mangan and Phibbs (1989), the I-O model developed for thisproject was extended as a demographic-economic (DECON) model. The two key characteristicsof the DECON model, when compared with a standard economic model, are as follows.• The introduction of a population ‘sector’ (or row and column in the model) makes itpossible to estimate the impact on local population levels of employment growth ordecline.• The introduction of an unemployed ‘sector’ makes it possible to account for theconsumption-induced impact of the unemployed in response to economic growth ordecline.A range of data for construction of the DECON model was obtained from the Australian Bureauof Statistics’ 2011 Census of Population and Housing (using the ABS TableBuilder database).Another aspect of the I-O models developed for this project was the inclusion of an additionalcolumn in the final demand quadrant of the model, namely a profile of sales of goods andservices to visitors to the region (i.e. expenditure by tourists). The following method and datasources were used to estimate a profile of tourism expenditure (or sales to final demand) on<strong>Kangaroo</strong> <strong>Island</strong> for 2011/12 (see also Table 2.1).• The base data for 2011/12 were sourced from Tourism Research Australia (TRA)(www.tra.australia.com). These data were supplemented with information obtainedfrom TRA (pers. comm.).e c o n s e a r c hPage| 4
<strong>Kangaroo</strong> <strong>Island</strong> Futures Authority Draft Economic Impact of Agriculture and TourismooThe key data were total tourism expenditure by tourism region and averageexpenditure profiles, by region, across a range of goods and services (e.g. foodand drink, fuel, shopping, etc.).Estimates were available for domestic day, domestic overnight andinternational visitor expenditure.• The first significant adjustment to the base data was the application of a more detailedexpenditure breakdown from the ABS Australian National Accounts: Tourism SatelliteAccount, 2011/12 for both domestic and international visitor expenditure (ABS 2011b).• The second significant adjustment to the base data was the conversion of tourismexpenditure estimates from purchasers’ to basic prices (i.e. reallocation of net taxes(taxes minus subsidies) and marketing and transport margins) to make the dataconsistent with accounting conventions used in both the national and regionaltransactions (I-O) tables. Purchasers’ to basic price ratios were derived from ABS(2011b).• The final adjustment to the base data was the allocation of the tourism expendituredata in basic prices to the relevant input-output sectors (66 intermediate sectors,other value added or imports) in which the expenditure occurred, thus compiling aprofile of sales to final demand. This process was undertaken for each type of tourismexpenditure (domestic day, domestic overnight and international visitor) and theresults aggregated to form a single tourism demand profile.Table 2.1Steps undertaken to estimate total tourism sales to final demand for <strong>Kangaroo</strong><strong>Island</strong>, 2011/12Base Data and Adjustments $m SourceBase DataTourism expenditure (purchasers' prices) for <strong>Kangaroo</strong> <strong>Island</strong>Tourism Research AustraliaDomestic Day 3Domestic Overnight 96International 24Total expenditure 123Allocation to input-output sectorsTourism expenditure (basic prices) for <strong>Kangaroo</strong> <strong>Island</strong>EconSearch analysisSales to final demand 61Other Value Added 7Imports 36Total expenditure 123The data described above were incorporated into a Microsoft Excel® spreadsheet basedeconomic impact model for the region (i.e. RISE v3.0). This type of model allows for descriptionof the structure of the economy. It can also be used for the estimation of economic impactsover time in response to the introduction of a new industry, the impact of an existing industryor a change in the final demand for the output of one or many sectors. Model assumptions canbe modified to account for:• price changes between the model construction year (2011/12) and the base year forthe analysis;e c o n s e a r c hPage| 5
<strong>Kangaroo</strong> <strong>Island</strong> Futures Authority Draft Economic Impact of Agriculture and Tourism• labour productivity change over time (as above and for the subsequent years); and• the level of regional migration (e.g. for a positive employment impact, the proportionof new jobs filled by previously unemployed locals).The economic impact model developed for <strong>Kangaroo</strong> <strong>Island</strong> for this project (and for SA) wasspecified in terms of 66 intermediate sectors. Sector specification in terms of the nationalinput-output sectors is detailed in Appendix 1. An overview of economic impact analysismethodology, including a description of extending the standard I-O model as a DECON modeland incorporating a tourism demand profile, is provided in Appendix 2. A glossary of I-Oterminology is provided in Appendix 3.2.3 Indicators of Economic ImpactThe following indicators of economic impact were generated using the economic modellingframework described above:• gross regional product (GRP)/ gross state product (GSP)• household income• employment.Gross regional product (GRP)/ gross state product (GSP) is a measure of the net contributionof an activity to the regional economy. GRP is measured as value of output less the cost ofgoods and services (including imports) used in producing the output. In other words, it can bemeasured as the sum of household income, 'gross operating surplus and gross mixed incomenet of payments to owner managers' and 'taxes less subsidies on products and production'. Itrepresents payments to the primary inputs of production (labour, capital and land). Using GRPas a measure of economic impact avoids the problem of double counting that may arise fromusing value of output for this purpose.Household income is a component of GRP and is a measure of wages and salaries paid in cashand in-kind, drawings by owner operators and other payments to labour including overtimepayments, employer’s superannuation contributions and income tax, but excluding payroll tax.Employment is a measure of the number of working proprietors, managers, directors andother employees, in terms of the number of full-time equivalent (fte) jobs. Employment ismeasured by place of remuneration rather than place of residence.Estimates of economic impact are presented in terms of:• direct (or initial) impacts• indirect (or flow-on) impacts• total impacts.Direct (or initial) impacts are an estimate of the change in final demand or level of economicactivity that is the stimulus for the total impacts.e c o n s e a r c hPage| 6
<strong>Kangaroo</strong> <strong>Island</strong> Futures Authority Draft Economic Impact of Agriculture and TourismIndirect (or flow-on) impacts are the sum of production-induced impacts, consumptioninducedimpacts and offsetting consumption effects.• Production-induced impacts are the sum of first-round impacts (i.e. estimates of therequirement for, or purchases of, goods and services from other sectors in theeconomy generated by the initial economic activity) and industrial support impacts(i.e. output and employment resulting from second, third and subsequent rounds ofspending by firms). Production-induced impacts are sometimes referred to as 'indirecteffects'.• Consumption-induced impacts are additional output and employment resulting fromre-spending by households that receive income from employment in direct andindirect activities. Consumption-induced effects are sometimes referred to as 'inducedeffects'.• Offsetting consumption effects are 'lost' consumption expenditure by the localunemployed before taking a job or 'new' consumption expenditure of those losing ajob as they shift to welfare payments.Total impacts are the sum of direct and indirect (flow-on) impacts.e c o n s e a r c hPage| 7
<strong>Kangaroo</strong> <strong>Island</strong> Futures Authority Draft Economic Impact of Agriculture and Tourism3. REVIEW AND CONSULTATION3.1 Aim of the Consultation ProcessIt is important that the growth targets and subsequent scenarios used in this study’s impactanalysis are seen to be realistic by key stakeholders representing various government agencies,industry bodies and major commercial operators who may be instrumental in delivering thegrowth.A targeted stakeholder engagement program was undertaken in November 2012 to January2013 to assist in setting targets and developing scenarios. The stakeholder list is available inAppendix 5.3.2 Review of Policy, Planning and Program DocumentsAs a precursor to the consultation process a selection of policy, planning and programdocuments was reviewed (see Appendix 4). The list is not meant to be complete but rather across section of examples. The purpose of considering these documents was to confirm thatthe scenarios that have been developed for use in the economic impact modelling have areasonable chance of being delivered based on levels of support (i.e. understanding,leadership, commitment, resourcing, etc.) from policy makers and the <strong>Kangaroo</strong> <strong>Island</strong> tourismindustry particularly.The discussion of the documents is aimed at identifying growth inhibitors like the cost andavailability of access to the <strong>Island</strong> and growth facilitators like the alignment (or otherwise) ofthe scenarios with local, state and commonwealth government policy and planning. Thediscussion focuses only on points that may be relevant for this purpose and should not beconsidered complete. They should be read in conjunction with the respective documents thatare available at the sources described.The documents reviewed for this section, listed in Appendix 4, can be divided into threecategories:1. Local and regional policy, planning and programs2. State government policy, planning and programs3. Commonwealth government policy, planning and programsOverall these policy, planning and programs demonstrate a strong alignment of the prioritiesfor various local, regional, state and commonwealth government agencies with growth targets,priorities and possible strategies for the <strong>Kangaroo</strong> <strong>Island</strong> tourism and agriculture industries.Other key observations include:1. Links between environmental protection and conservation and Brand <strong>Kangaroo</strong> <strong>Island</strong> fortourism are clearly made and reinforced by the status of <strong>Kangaroo</strong> <strong>Island</strong> in theCommonwealth’s National Landscapes Program. This is also important for the branding oflocally produced agricultural products.e c o n s e a r c hPage| 8
<strong>Kangaroo</strong> <strong>Island</strong> Futures Authority Draft Economic Impact of Agriculture and Tourism2. Infrastructure priorities that may facilitate increased visitation to <strong>Kangaroo</strong> <strong>Island</strong> mapclosely with the policies and planning of various government agencies and other bodiessuch as the South Australian Department of Planning, Transport and Infrastructure. Thereis a strong focus on transport infrastructure with the status of access to <strong>Kangaroo</strong> <strong>Island</strong> bysea and air particularly pronounced.3. There is a sense of integrated policy development in references to public infrastructureand the provision of community services like health and education for both the residentpopulation and itinerant visitors to <strong>Kangaroo</strong> <strong>Island</strong>.4. It is important to recognise the targets of South Australia’s Strategic Plan (SASP) in thescenarios for economic modelling in order to strengthen the policy alignment and providea sense of continuity. Tourism industry targets set by regional planning and industry bodiessuch as SA Tourism Commission and Tourism <strong>Kangaroo</strong> <strong>Island</strong> also reflect the SASP targets.3.3 Growth LimitersA discussion paper entitled Impact of Agriculture and Tourism Industries on the <strong>Kangaroo</strong><strong>Island</strong> Economy: Notes for Consultation (Appendix 6) was produced and circulated prior to thecommencement of consultations. The discussion paper identified draft scenarios and focusedon potential ‘growth limiters’ and their impact on future growth. The potential growth limiterswere identified from a desk top study of various documents referred to in Section 3.2 of thisreport and discussed in Appendix 4.The following list of growth limiters is not exclusive and others were identified by stakeholdersas the consultation process unfolded.General Growth Limiters1. The availability of a consistent and agreed data and information set that can be applied inthe development of business cases, strategies and plans such as the SA Strategic Plan and<strong>Kangaroo</strong> <strong>Island</strong> Tourism Plan2. The cost, nature (e.g. style, point of origin) and availability (e.g. scheduling) of access to<strong>Kangaroo</strong> <strong>Island</strong> for residents, visitors and freight3. The quality and availability of ‘gateway’ infrastructure providing access to <strong>Kangaroo</strong> <strong>Island</strong>or from <strong>Kangaroo</strong> <strong>Island</strong> to other destinations. Examples include:a. <strong>Kingscote</strong> airportb. Penneshaw and Cape Jervis seaportsc. <strong>Kingscote</strong> portd. other potential seaports, bulk handling facilities and processing plants such as BallastHead/ American River4. The maintenance and augmentation of sealed and unsealed roads, trails and other internaltransport systems5. The supply of essential services infrastructure including water, waste, electricity andhousing6. The availability of business and community services infrastructure including health andeducation facilities for general purpose servicing of residents and visitorse c o n s e a r c hPage| 9
<strong>Kangaroo</strong> <strong>Island</strong> Futures Authority Draft Economic Impact of Agriculture and Tourism7. The development and application of environmental policy that places constraints oneconomic development in order to conserve and enhance natural assets8. The development and application of wildlife protection and resource management policysuch as Marine Parks9. The costs of development and returns on investment for comparable development on<strong>Kangaroo</strong> <strong>Island</strong> and alternative sites on the mainland10. Constraints related to emergency plans such as action plans for natural risks like bushfireand other extreme eventsTourism Growth Limiters1. The quality and availability of ‘gateway’ infrastructure providing access to <strong>Kangaroo</strong> <strong>Island</strong>or from <strong>Kangaroo</strong> <strong>Island</strong> to other destinations. Examples include:a. marinas such as Christmas Cove and <strong>Kingscote</strong>b. boat ramps and other service points with mixed use such as emergency services,recreational fishing and commercial fishing safe havens.2. The upgrade and addition of tourism infrastructure such as ‘hero (iconic) experiences’ andaccommodation with a focus on the high end market and encouraging visitors to staylonger3. Support for industry development appropriate for tourism linkage such as agriculture,viticulture, wine making, art, culture, recreation and sport to encourage food and winetourism, art and culture tourism and recreation / adventure tourism4. The role of land use planning such as appropriate zoning for tourism development likeaccommodation, farm stay and microenterprise development5. The development and maintenance of public and private facilities including camping andcaravanning parks, rest stations, ablutions and liquid waste sumps for boat andrecreational vehicle use6. Natural limits for visitor flows to key attractions based on environmental, wildlifeprotection or logistical (e.g. safe road carrying capacity) factorsAgriculture Growth Limiters1. Allocation of water resources2. Threat of pest and disease incursions on clean green image (as well as cost and yieldeffects)3. Fragmentation and loss of productive agricultural land to other land uses4. Development Plan regulations that prevent, or make difficult, a change in land use5. Lack of incentives and opportunities to develop value adding clusters and medium to largevalue adding opportunitiesSummary of consultation1. Generally speaking the consultation confirmed that the <strong>Kangaroo</strong> <strong>Island</strong> tourism industryhad considerable potential for growth and there was optimism amongst thosestakeholders consulted.e c o n s e a r c hPage| 10
<strong>Kangaroo</strong> <strong>Island</strong> Futures Authority Draft Economic Impact of Agriculture and Tourism2. Growth was seen to be possible at or near current trend in the short term (0-4 years)mainly utilising latent capacity in available infrastructure and building on past successes indomestic and international markets.3. For growth to be delivered above trend and beyond the short term, it was generally feltthat major investment in key infrastructure including new experiences would be necessaryalong with the development of new / emerging markets. Particular infrastructureidentified to support new international market development such as China includedairport upgrade and additional four plus star accommodation.4. The most common issue raised by stakeholders was the need to address the cost,availability and quality of access options by sea and air for visitors to <strong>Kangaroo</strong> <strong>Island</strong>.However there was a divided view about how to tackle this; some suggested governmentintervention such as a subsidy and others preferring market solutions to address thischallenge.5. Overall the targets of South Australia’s Strategic Plan were well understood bystakeholders as was the importance to ‘have everyone on the same page’ that recognisedthe need for policy alignment as described earlier.As with the tourism sector consultation, the agricultural industry consultation confirmed thatthe <strong>Kangaroo</strong> <strong>Island</strong> agricultural industry had significant potential for growth and there wasoptimism amongst those stakeholders consulted.For growth to be delivered above trend and beyond the short term, it was generally felt thatthe following four aspects of industry development would become the key drivers of growth.These are:• increase in production, brought about primarily by improvements in productivity;• reduced costs, particularly in the area of improved logistics;• premium branding of agricultural products; and• change in land use, in particular in the horticultural and other agricultural sectors.e c o n s e a r c hPage| 11
<strong>Kangaroo</strong> <strong>Island</strong> Futures Authority Draft Economic Impact of Agriculture and Tourism4. PROFILE OF ECONOMIC ACTIVITYON KANGAROO ISLAND4.1 <strong>Kangaroo</strong> <strong>Island</strong> Economy in 2011/12In order to set the context for the estimates of local economic impact of the agriculture andtourism industries (which follow), a brief profile of economic activity on <strong>Kangaroo</strong> <strong>Island</strong> in2011/12 is provided below. These data were derived from the I-O database constructed by theconsultants specifically for this project and incorporated into the <strong>Kangaroo</strong> <strong>Island</strong> RISE model.Estimates of employment and output by sector are detailed in Table 4.1 and gross regionalproduct (GRP) in Table 4.2.Table 4.1 Employment and output, <strong>Kangaroo</strong> <strong>Island</strong>, 2011/12SectorTotal employment Employment Value of outputno. of jobs % fte % $m %Agric, Forestry & Fishing 628 26.2% 709 30.4% 86 20.2%Mining 0 0.0% 0 0.0% 0 0.0%Manufacturing 59 2.4% 52 2.3% 16 3.7%Electricity, gas, water and waste services 26 1.1% 25 1.1% 10 2.4%Construction 92 3.8% 86 3.7% 40 9.5%Wholesale Trade 76 3.2% 78 3.3% 22 5.3%Retail Trade 259 10.8% 211 9.1% 22 5.3%Accommodation and food services 296 12.4% 224 9.6% 42 9.8%Transport, postal and warehousing 138 5.8% 161 6.9% 41 9.8%Information media and telecommunications 0 0.0% 0 0.0% 0 0.0%Financial and insurance services 24 1.0% 19 0.8% 10 2.5%Ownership of Dwellings 0 0.0% 0 0.0% 17 4.1%Rental, hiring and real estate services 17 0.7% 23 1.0% 10 2.3%Professional, scientific and technical service 73 3.0% 77 3.3% 19 4.5%Administrative and support services 84 3.5% 58 2.5% 13 3.1%Public administration and safety 152 6.3% 159 6.8% 25 5.9%Education and training 154 6.4% 149 6.4% 14 3.3%Health care and social assistance 217 9.0% 195 8.4% 21 5.0%Arts and recreation services 40 1.7% 45 1.9% 7 1.8%Other services 65 2.7% 57 2.5% 7 1.7%Total 2,399 100.0% 2,330 100.0% 424 100.0%aThe ownership of dwellings sector is a notional sector designed to impute a return to the region’s housingstock. Total value of output in this sector is an estimate of rent earned on leased dwellings and imputed rent onthe balance of owner-occupied dwellings.Source: ABS 2011 Census of Population and Housing, DEWR (2012) and EconSearch analysis.It was estimated that there were approximately 2,400 jobs (around 2,330 fte jobs) on<strong>Kangaroo</strong> <strong>Island</strong> in 2011/12 (Table 4.1).The top five contributors to total jobs in the region in2011/12 were:• agriculture, forestry and fishing (26 per cent);• accommodation and food services (12 per cent);e c o n s e a r c hPage| 12
<strong>Kangaroo</strong> <strong>Island</strong> Futures Authority Draft Economic Impact of Agriculture and Tourism• retail trade (11 per cent);• health care and social assistance (9 per cent); and• education and training (6 per cent).In 2011/12 employment in South Australia was approximately 851,100 (total jobs) whichmeans <strong>Kangaroo</strong> <strong>Island</strong> accounts for approximately 0.3 per cent of the total state employment.Table 4.2Household income, other value added and gross regional product, <strong>Kangaroo</strong><strong>Island</strong>, 2011/12 aSectorHousehold income Other value added Gross regional product$m % $m % $m %Agric, Forestry & Fishing 32 23.1% 8 11.6% 40 18.4%Mining 0 0.0% 0 0.0% 0 0.0%Manufacturing 3 2.6% 2 2.8% 5 2.5%Electricity, gas, water and waste services 2 1.5% 3 4.5% 5 2.4%Construction 8 5.9% 3 3.9% 11 5.0%Wholesale Trade 7 4.9% 4 6.0% 11 5.0%Retail Trade 9 6.6% 4 6.3% 13 6.2%Accommodation and food services 11 7.7% 9 12.4% 19 8.9%Transport, postal and warehousing 10 7.5% 8 11.5% 18 8.5%Information media and telecommunications 0 0.0% 0 0.0% 0 0.0%Financial and insurance services 3 2.0% 5 7.4% 8 3.7%Ownership of Dwellings 0 0.0% 13 18.8% 13 6.1%Rental, hiring and real estate services 2 1.5% 2 2.3% 4 1.7%Professional, scientific and technical service 6 4.1% 3 3.8% 8 3.8%Administrative and support services 6 4.5% 0 0.5% 7 3.0%Public administration and safety 11 8.1% 2 3.5% 14 6.3%Education and training 9 6.8% 1 1.4% 10 4.8%Health care and social assistance 13 9.2% 1 2.1% 14 6.5%Arts and recreation services 3 2.2% 0 0.5% 3 1.5%Other services 2 1.8% 1 0.7% 3 1.4%Intermediate total 137 100.0% 70 100.0% 207 95.6%Net taxes in final demand b - - - - 10 4.4%Total 137 100.0% 70 100.0% 217 100.0%abHousehold income and other value added are the two components of GRP. Using the income method to deriveGRP enables its estimation on a sector-by-sector basis.Includes net taxes (i.e. taxes less subsidies on products and production) paid by households and othercomponents of final demand.Source: ABS (2012d) and EconSearch analysis.GRP on <strong>Kangaroo</strong> <strong>Island</strong> in 2011/12 was estimated to be $217 million (Table 4.2). Thecontribution of an individual industry to GRP is calculated as the sum of household income,gross operating surplus and gross mixed income and indirect taxes less subsidies. The top fivecontributors to GRP were:• agriculture, forestry and fishing (18 per cent);• accommodation and food services (9 per cent);• transport postal and warehousing (8 per cent);e c o n s e a r c hPage| 13
<strong>Kangaroo</strong> <strong>Island</strong> Futures Authority Draft Economic Impact of Agriculture and Tourism• health care and social assistance (6 per cent); and• public administration and safety (6 per cent).In 2011/12 South Australia’s gross state product was $91.93 billion which means that <strong>Kangaroo</strong><strong>Island</strong> accounts for approximately 0.2 per cent of the state economy. Economic activity on<strong>Kangaroo</strong> <strong>Island</strong> is dominated by agriculture, forestry and fishing but, as demonstrated inSection 5 below, the tourism industry is also a significant contributor with associatedaccommodation, transport and retail service sectors.4.2 <strong>Kangaroo</strong> <strong>Island</strong> Economy: Recent TrendsEmployment• Between 2007/08 and 2011/12 total employment on <strong>Kangaroo</strong> <strong>Island</strong> has grown by 4per cent similar to SA as a whole. The annual rate of employment growth, and that forSouth Australia, is shown in Figure 4-1.• Due to the small sample size, annual fluctuations for small regions can be significant.Figure 4-1Employment rate of growth: <strong>Kangaroo</strong> <strong>Island</strong> and South AustraliaSource: ABS (2012d) and EconSearch analysis.Gross Regional ProductGrowth in GRP in real terms is shown in Figure 4-2 for <strong>Kangaroo</strong> <strong>Island</strong> and South Australia.• Between 2006/07 and 2011/12 GRP for <strong>Kangaroo</strong> <strong>Island</strong> grew by 20 per centcompared to 13 per cent for SA as a whole (real).e c o n s e a r c hPage| 14
<strong>Kangaroo</strong> <strong>Island</strong> Futures Authority Draft Economic Impact of Agriculture and Tourism• The annual rate of economic growth over the five years to 2011/12, as measured bygross regional product, was 3.6 per cent per annum compared with the state growthrate of 2.5 per cent per annum.Figure 4-210%8%Gross regional product rate of growth: <strong>Kangaroo</strong> <strong>Island</strong> and South AustraliaGRP % Annual Change (real)6%4%2%0%-2%2007/08 2008/09 2009/10 2010/11 2011/12-4%<strong>Kangaroo</strong> <strong>Island</strong>South AustraliaSource: EconSearch analysis and ABS (2012d).e c o n s e a r c hPage| 15
<strong>Kangaroo</strong> <strong>Island</strong> Futures Authority Draft Economic Impact of Agriculture and Tourism5. ECONOMIC CONTRIBUTION OFTOURISM5.1 Visitor Numbers and Tourism ExpenditureEstimates of the number of visitors and associated visitor expenditure on <strong>Kangaroo</strong> <strong>Island</strong> in2011/12 are detailed for domestic day, domestic overnight and international visitors in Table5.1. Tourism expenditure was estimated using an average of the Tourism Research Australia(TRA 2012) estimates on visitor expenditure on <strong>Kangaroo</strong> <strong>Island</strong> for the last 5 years inflated to2012 dollars. The total number of visitors was sourced from the TOMM visitor exit survey(Colmar Brunton 2012).The total number of tourists visiting <strong>Kangaroo</strong> <strong>Island</strong> in 2011/12 was around 194,000 persons.The associated expenditure for these tourists on <strong>Kangaroo</strong> <strong>Island</strong> in 2011/12 was estimated tobe $123 million (Table 5.1). Domestic day visitors accounted for around 20 per cent of the totalvisitors to the <strong>Island</strong> in 2011/12 but these visitors only accounted for 3 per cent of total visitorexpenditure. Domestic overnight visitors made up the largest share of total visitor numbers (59per cent) and of total visitor expenditure (78 per cent). International visitors accounted for 21per cent of the total visitors to the <strong>Island</strong> and 19 per cent of total visitor expenditure (Table5.1).Table 5.1 Visitor expenditure on <strong>Kangaroo</strong> <strong>Island</strong>, 2011/12Total ExpenditureTotal VisitorsExpenditure perVisitor$m % '000 % $Domestic Day 3 3% 40 20% 84Domestic Overnight 96 78% 114 59% 839International 24 19% 40 21% 593Total 123 100% 194 100% 634Source: Tourism Research Australia (www.tra.australia.com), Colmar Brunton 2012 and EconSearch analysis.e c o n s e a r c hPage| 16
<strong>Kangaroo</strong> <strong>Island</strong> Futures Authority Draft Economic Impact of Agriculture and TourismFigure 5-1 Number of visitors on <strong>Kangaroo</strong> <strong>Island</strong>, 2011/12Source: Tourism Research Australia (www.tra.australia.com), Colmar Brunton 2012 and EconSearch analysis.Figure 5-2 Visitor expenditure on <strong>Kangaroo</strong> <strong>Island</strong>, 2011/12Source: Tourism Research Australia (www.tra.australia.com), Colmar Brunton 2012 and EconSearch analysis.5.2 Economic Contribution of TourismWhilst tourism is not specified as a sector within the I-O model, the relative contribution oftourism to economic activity on <strong>Kangaroo</strong> <strong>Island</strong> can be measured adopting the standardAustralian Bureau of Statistics method (ABS 2011b) and estimates are provided in Table 5.2. Anexplanation of how the profile of tourism expenditure summarised in Table 5.2 was estimatedis provided in Section 2.2.Total tourism expenditure on the <strong>Island</strong> in 2011/12 ($123 million) corresponds with theestimate in Section 2.2 and includes net taxes (principally GST) and expenditure on importedgoods and services from other regions in SA, interstate and overseas. Estimates of tourisme c o n s e a r c hPage| 17
<strong>Kangaroo</strong> <strong>Island</strong> Futures Authority Draft Economic Impact of Agriculture and Tourismexpenditure are in basic prices, that is, net of net taxes (i.e. taxes minus subsidies) andmarketing and transport margins.In aggregate, it was estimated that expenditure by tourists on <strong>Kangaroo</strong> <strong>Island</strong> in 2011/12generated the following level of regional economic activity (Table 5.2).• Approximately $54 million in GRP which represents 25 per cent of the regional total($217 million in Table 5.2).• Approximately 560 full-time and part-time jobs which represent 23 per cent of theregional total (2,400 total jobs in Table 5.2).• Approximately 470 fte jobs which represents 20 per cent of the regional total (2,330fte in Table 5.2).Table 5.2The contribution of tourism to GRP and employment on <strong>Kangaroo</strong> <strong>Island</strong>,2011/12TourismaGRP ImpactExpenditureEmployment Impact$m $m fte Total JobsWine and other food products 1 1 7 8Wholesale trade 2 2 17 17Retail trade 15 8 127 156Accommodation and food services 40 16 187 248Transport 8 3 30 25Ownership of dwellings 8 6 0 0Property and business services 1 4 37 41Education 0 0 6 7Health and community services 0 1 10 11Cultural and recreational services 3 1 12 11Personal Services 0 1 11 13Other Sectors 2 3 25 26Net Taxes b 7 7 - -Imports 36 - - -Total (Tourism) 123 54 471 562Regional Total c - 217 2,330 2,399Tourism Contribution to RegionalTotal- 25% 20% 23%abcIn basic prices, that is, net of net taxes (taxes minus subsidies) and marketing and transport margins. Furtherdescription of the method used to estimate this profile of tourism expenditure is provided in Section 2.2.Indirect taxes (principally GST) less subsidies.Derived from the <strong>Kangaroo</strong> <strong>Island</strong> RISE model for 2011/12.Source: EconSearch analysise c o n s e a r c hPage| 18
<strong>Kangaroo</strong> <strong>Island</strong> Futures Authority Draft Economic Impact of Agriculture and Tourism6. ECONOMIC CONTRIBUTION OFAGRICULTURE6.1 Area and Value of ProductionThis section provides a set of agricultural and forestry data extracted from the ABS and othersources. According to the ABS Agricultural Census, most recently published in November 2012,the area of land used for field crops decreased by almost 30 per cent between 2006 and 2011(Table 6.1), however the non-reporting (n.p.) of the ‘Pasture and other crops cut for hay’ areamasks the extent of any change that may have occurred in this variable.Table 6.1 Area of agricultural production, <strong>Kangaroo</strong> <strong>Island</strong>, 2006 and 20112006 2011Field Crops (ha)Pasture and other crops cut for hay a 6,978 n.p.Wheat 3,880 4,885Oats 2,334 1,862Barley 3,087 1,639Triticale 612 254Other cereals 947 661Canola 3,499 6,297Lupins for grain or seed 1,738 515Field peas for grain 267 136Field Beans 198 136All other broadacre crops n.e.c 81 354Total Field Crops a 23,621 16,739Horticulture (ha)Winegrapes 87 118Orchard fruit and nut trees 25 16Vegetables 1 3Vegetables for seed 17 225Nurseries & cut flowers & cultivated turf 2 n.p.Total Horticulture 132 362Livestock (no.)Cattle 28,630 20,635Dairy Cattle n.p. 2Pigs 363 143Poultry - eggs 39,145 n.p.Sheep and lambs 681,356 558,611Other livestock 680 272Total Livestock 750,175 579,663a Because the area of ‘Pasture and other crops cut for hay’ is not published (n.p.) in 2011, the ‘Total Field Crops’estimate is significantly lower than the 206 estimate.Source: ABS 2012f and previous issuese c o n s e a r c hPage| 19
<strong>Kangaroo</strong> <strong>Island</strong> Futures Authority Draft Economic Impact of Agriculture and TourismThe area of land used for horticulture has more than doubled over the 5 year period butremains a relatively small user of agricultural land on <strong>Kangaroo</strong> <strong>Island</strong> (362 ha in 2011) (Table6.2.According to the Phylloxera Grape and Industry Board South Australia there were 142 haplanted to winegrapes in 2011/12. The majority of the land planted to winegrapes is plantedwith red varieties (approximately 80 per cent) (Table 6.2). Note the discrepancy with theAgricultural Census data which indicates 118 ha of winegrapes. Although the reference yearfor the Agricultural Census is 12 months earlier, it does reinforce the commonly held view inconsultations that the Census data are generally more likely to understate than overstate thelevel of activity (production, value, area).Table 6.2 Area planted to winegrapes, <strong>Kangaroo</strong> <strong>Island</strong>, 2011/12Winegrape Variety Area (ha) Share (%)Cabernet Franc 6 4%Cabernet Sauvignon 46 32%Merlot 5 4%Other red 7 5%Shiraz 51 36%Chardonnay 10 7%Other white 5 4%Riesling 3 2%Sauvignon Blanc 7 5%Unknown Variety 3 2%Total 142 100%Source: PGIBSA 2012The value of agricultural production for the three census years, 2001, 2006 and 2011 isprovided in Table 6.3 in nominal dollars. In nominal terms the total value of agriculturedecreased by approximately 23 per cent between 2001 ($45.6m) and 2006 ($35.0m) butalmost doubled between 2006 and 2011 ($67.4m).It should be noted that the value of agricultural production in 2006 was particularly low due tothe drought. Over the 10 year period, 2001 to 2011, the total value of agriculture increased by48 per cent. In real terms, over the same period, the total value of agriculture increased byaround 10 per cent.e c o n s e a r c hPage| 20
<strong>Kangaroo</strong> <strong>Island</strong> Futures Authority Draft Economic Impact of Agriculture and TourismTable 6.3Value of agricultural production on <strong>Kangaroo</strong> <strong>Island</strong>, 2001, 2006, 2011 (nominaldollars)2001 2006 2011Field cropsCereals for grain 4.5 4.0 6.0Legumes for grain 0.9 0.8 0.6Oilseeds 2.0 1.6 6.1Pasture and other crops cut for hay 3.0 4.3 3.1Total Field Crops 10.3 10.8 15.8Fruit, Vegetables & NurseriesWine grapes 0.2 0.2 0.1Other fruit 0.3 0.0 0.1Vegetables and seeds 0.1 0.3 4.6Nurseries & cut flowers & cultivated turf 0.0 0.3 n.p.Total Fruit, Vegetables & Nurseries 0.6 0.8 4.8LivestockCattle and calves 4.6 4.4 5.1Sheep and lambs 11.7 12.6 27.6Other livestock 0.1 0.5 1.7Wool 17.9 5.0 11.2Other livestock products 0.4 0.9 1.2Total Livestock 34.7 23.4 46.8Total Agriculture 45.6 35.0 67.4Source: ABS (2012g) and previous issues6.2 Economic Contribution of AgricultureThe direct value of agricultural output on <strong>Kangaroo</strong> <strong>Island</strong> in 2011/12 was estimated to be$69.4m (Table 6.4). This estimate was based on data sourced from ABS (2012g) ($67.4m inTable 6.3) with some modifications based on industry consultation. These modifications werelargely around the value of wool produced, which appeared to be significantly underestimatedin the Agricultural Census 2 .In Table 6.4 adjusted farm gate value of agricultural production is provided as well as eachsector’s direct contribution to gross regional product and employment. It should be noted that2Wool production on <strong>Kangaroo</strong> <strong>Island</strong> in 2011/12 was estimated to be 2,600,000 kg. Production bymicron segment was estimated on the basis of the latest year available (2009/10). Clean wool yieldfrom greasy was assumed to average 69%. Production by micron segment was applied to AustralianWool Exchange (AWEX) prices for the southern market. An initial adjustment to prices (7%reduction) was made as the wool clip includes pieces, bellies, locks, etc. and therefore can beexpected to achieve a lower average price than the AWEX MPG for the same micron. Furtheradjustments (9.5% reduction) were made for selling charges including wool tax, testing charges andAWEX levy. Based on these calculations the value of wool production on <strong>Kangaroo</strong> <strong>Island</strong> in 2011/12was estimated to be approximately $17.5 million (compared with Agricultural Census estimate of$11.2 million).e c o n s e a r c hPage| 21
<strong>Kangaroo</strong> <strong>Island</strong> Futures Authority Draft Economic Impact of Agriculture and Tourismthe allocation of employment by sector is an estimate based on the 2011 Census of Populationand Housing. Because many farms are mixed enterprise operations many people work acrosssectors and it is not possible to attribute that employment with a high degree of confidence.More confidence, however, can be placed in the aggregate employment data.Table 6.4Direct impact of agricultural production (adjusted), 2011 (nominal dollars)Gross Value ofCommodityProductionGRP Employment$m $m fteSheep 42.5 18.5 370Grains 12.4 5.4 70Beef 5.2 2.2 121Poultry 1.2 0.6 27Other Livestock 0.8 0.4 27Winegrapes 0.3 0.2 9Vegetables 4.4 2.2 12Other Agriculture 2.6 1.3 4Total Agriculture 69.4 30.8 639Source: ABS (2012g) and EconSearch analysis.The definition of the agriculture value chain is consistent with that employed in PIRSA’s Foodfor the Future value-chain analysis. The following stages in the marketing chain have,therefore, been included in the direct economic impact:• the direct value of agricultural output (gross value of production) 3 ; and• downstream impacts, including the net value of local (i.e. regional) agriculturalproducts processing and the net value of local retail and food service (e.g. hotels &restaurants) trade in these products.Estimates of the net value of local processing margins and retail and food service trademargins were derived from PIRSA’s Scorecard for the region for 2005/06 (PIRSA, pers. comm.).Estimates of the economic contribution of the agriculture value chain to the <strong>Kangaroo</strong> <strong>Island</strong>economy in 2011/12 are presented in Table 6.5. The value of locally processed agriculturaloutput was estimated to be approximately $4.7m, whilst retail and food service marginsassociated with trade in these products generated another $3.7m in direct output.3Value of output is a measure of the gross revenue of goods and services produced by commercial organisations(e.g. farm-gate value of production) and gross expenditure by government agencies. Total output needs to beused with care as it can include elements of double counting when the output of integrated industries is addedtogether (e.g. the value of winery output includes the farm-gate value of grapes).e c o n s e a r c hPage| 22
<strong>Kangaroo</strong> <strong>Island</strong> Futures Authority Draft Economic Impact of Agriculture and TourismTable 6.5Economic contribution of the agriculture value chain to the <strong>Kangaroo</strong> <strong>Island</strong>economy in 2011/12 aValue of Output b Gross regionalproductEmployment$m $m fteDirect ImpactAgriculture 69.4 30.8 639Processing 4.7 1.0 8Retail 2.2 1.3 21Food services 1.5 0.7 8Total Direct Impact 77.8 33.9 676Flow-on ImpactServices to agriculture 1.6 10Other manufacturing 0.6 6Wholesale trade 2.8 20Retail trade 2.1 33Accommodation and food services 2.1 24Transport and storage 1.5 15Finance and insurance 1.9 5Ownership of dwellings 3.5 0Property and business services 3.0 26Education 0.6 8Health and community services 1.0 15Personal services 0.8 15Other sectors 3.0 20Total Flow-on Impact 24.4 196Total Impact 58.3 872Regional total 216.8 2,330Proportion of regional total 27% 37%abDollar values in the table are expressed in 2012 dollars.Flow-on and total output impacts are not reported as there are problems with double counting which can givea misleading impression of the significance of individual industries. For example, the value of livestockprocessed locally is included in both the processing and agriculture sectors. If the two values were addedtogether the farm-gate value of livestock would be included twice.Source: ABS 2012g and EconSearch analysisThe <strong>Kangaroo</strong> <strong>Island</strong> agriculture value chain was estimated to generate a total GRP impact ofapproximately $58.3m in 2011/12. Agriculture was estimated to directly generateapproximately $30.8m in GRP whilst downstream impacts (i.e. processing and retail/foodservice trade) generated an additional $3.0m in GRP. Flow-on GRP in other sectors of the<strong>Kangaroo</strong> <strong>Island</strong> economy was estimated to be approximately $24.4m in 2011/12,concentrated in the retail and wholesale trade, transport and storage, property and businessservices and ownership of dwellings sectors.There was also significant activity generated in some of the hospitality and social servicesectors with the accommodation and food services, education, health and personal servicese c o n s e a r c hPage| 23
<strong>Kangaroo</strong> <strong>Island</strong> Futures Authority Draft Economic Impact of Agriculture and Tourismsectors contributing, in aggregate, $4.5m in GRP. The total GRP impact of $58.3m represents27 per cent of the regional total in 2011/12.The <strong>Kangaroo</strong> <strong>Island</strong> agriculture value chain was estimated to generate over 870 fte jobs in2011/12. Agriculture was estimated to directly generate approximately 639 fte jobs, whilstdownstream impacts generated an additional 37 fte. Flow-on employment in other sectors ofthe regional economy was estimated to sum to 196 fte jobs in 2011/12, concentrated in thewholesale and retail trade, transport and storage, and property and business services sectors.As with GRP, there were also a significant number of jobs generated in the hospitality andsocial service sectors with the accommodation and food services, education, health andpersonal services sectors contributing, in aggregate, 62 fte jobs. The total employment impact(872 fte jobs) represented 37 per cent of the regional total in 2011/12.e c o n s e a r c hPage| 24
<strong>Kangaroo</strong> <strong>Island</strong> Futures Authority Draft Economic Impact of Agriculture and Tourism7. PATHWAYS TO GROWTH7.1 TourismA number of milestone developments were identified during the desk top study of policyalignment and subsequently supported by consultation with key stakeholders (Appendix 5).These included:1. Upgrade of <strong>Kingscote</strong> <strong>Airport</strong>2. Development of tourism experiences and accommodation3. Upgrade to utilities such as power and water supply4. Maintenance and development of road and trail infrastructure5. Development of export infrastructure such as bulk handling facilities6. Development of value adding infrastructure such as processing of agricultureproductsEssentially the growth potential in the tourism and agricultural sectors was seen to span theshort, middle and longer terms. Short-term growth at trend and higher was seen to be possibleutilising spare infrastructure and service capacity in the economy. However, to extend thisgrowth beyond the short-term, significant investment was required in milestonedevelopments.A feature of this development was likely to be a ‘leaking’ of benefits of this direct investmentfrom the <strong>Kangaroo</strong> <strong>Island</strong> economy to the broader regional economy. This was a product of thenarrow economy being unable to support major construction and the need for products andservices outside the scope of the existing industry profile on the <strong>Island</strong>. Therefore a measure ofthe direct investment in conventional terms (i.e. impact on GRP and jobs) was likely to berelatively small. The real benefits to the <strong>Kangaroo</strong> <strong>Island</strong> economy however should be seen asthe cumulative effect of the direct investment in the milestone development plus the benefitsthat accrue from the growth in key industry sectors such as tourism and agriculture. In otherwords, it is unlikely that growth in these sectors will occur at significant levels beyond theshort-term without a timely investment in milestone development.The example of investment in the <strong>Kingscote</strong> <strong>Airport</strong> upgrade is provided below. A similartreatment could be applied to the other milestone investments listed above. Some of theseinvestments are contingent on one another. For example, significant barriers to growth wouldremain if access to <strong>Kangaroo</strong> <strong>Island</strong> was improved at peak times without a facilitating upgradeto the power and water supply.7.1.1 <strong>Kingscote</strong> <strong>Airport</strong> upgradeTonkin Consulting prepared a report on the engineering investigations that were undertakento estimate the infrastructure requirements and associated capital costs to upgrade the<strong>Kingscote</strong> <strong>Airport</strong> for four development scenarios (Tonkin Consulting 2012). The capital costsand on-going operating and maintenance costs for the upgrade options were utilised in thise c o n s e a r c hPage| 25
<strong>Kangaroo</strong> <strong>Island</strong> Futures Authority Draft Economic Impact of Agriculture and Tourismreport to estimate the economic impact that will occur to the local economy of <strong>Kangaroo</strong><strong>Island</strong> as a result of the expenditure. The four scenarios that are to be considered include:1. Maintain <strong>Kingscote</strong> <strong>Airport</strong> on an as-is basis without any deterioration in runway orpavement grade.2. Upgrade <strong>Kingscote</strong> <strong>Airport</strong> to accommodate Q400 aircraft operating sectors (at fullpassenger and cargo payload) as far as Melbourne3. Upgrade <strong>Kingscote</strong> <strong>Airport</strong> to accommodate regional jet services (F100) operatingsectors as far as Perth4. Upgrade <strong>Kingscote</strong> <strong>Airport</strong> to accommodate single-aisle mainline jet services(737/A320) to sectors as far as Perth7.1.1.1 Construction PhaseThe <strong>Kingscote</strong> <strong>Airport</strong> upgrade project will involve a total capital investment ranging between$9.8m for Scenario 2 to $37.1m for Scenario 4 (Table 7.1). There will be no capital investmentunder Scenario 1 as this is a business as usual scenario. The economic impact of theconstruction of the airport upgrade options will be determined by the extent of local labourand raw materials, the level of expenditures associated with the specialised contractors andequipment that will occur off <strong>Kangaroo</strong> <strong>Island</strong>.It was assumed that Scenarios 2 to 4 were of significant enough size to warrant a major civilcontractor from the main land. Therefore, the majority of the wages would not be retained onthe <strong>Island</strong> (Tonkin Consulting 2012) although it is likely they would be retained within theState.The direct expenditures that would occur on the <strong>Island</strong> are outlined in Table 7.1 and consistprincipally of the supply of sand material, pavement material and contractor employeeaccommodation and meals. Clearly, these expenditures comprise only a small proportion oftotal expenditure, ranging from just 5 per cent for Scenario 2 up to 17 per cent for Scenario 4.Table 7.1<strong>Kingscote</strong> <strong>Airport</strong> upgrade construction expenditure aExpenditure Categories Scenario 2 Scenario 3 Scenario 4Preliminaries $199,000 $199,000 $341,500Site Preparation and Earthworks $0 $22,822 $0Stormwater $0 $0 $0Pavement $211,562 $1,900,901 $5,663,957Lighting $0 $0 $0Building $135,600 $163,350 $377,200Design Fees $0 $0 $0Total Expenditure on <strong>Kangaroo</strong> <strong>Island</strong> b $546,162 $2,286,073 $6,382,657Mainland Expenditure $7,392,166 $11,016,612 $23,876,610Contingencies, GST & Levies $1,909,912 $3,386,632 $6,865,460Total Cost of Construction $9,848,241 $16,689,317 $37,124,727abScenario 1 is not shown as there are no construction costs associated with this scenario.Excludes contingencies, taxes and levies.Source: Tonkin Consulting (2012)e c o n s e a r c hPage| 26
<strong>Kangaroo</strong> <strong>Island</strong> Futures Authority Draft Economic Impact of Agriculture and TourismThe indirect/flow-on impacts were calculated using the I-O model constructed and updated forthis project and they measure the economic effects in other sectors of the economy (trade,health, manufacturing, business services, etc.) generated by these direct activities, that is, themultiplier effects.In addition to the assumptions embodied in the input-output model itself (see Appendix 2), itwas necessary to make a number of other general assumptions in estimating the economicimpacts:• The impacts were measured using models that represent the structure of the regionaland state economies for the year in which the most recent data are available(2011/12). However, over time there are likely to be improvements in primary factorproductivity in these economies. To allow for the improvements an across-the-board(all sectors) labour productivity improvement rate of 1 per cent per annum forsubsequent years of the construction have been incorporated into the modelling.• When new jobs are created, it should be determined where the people come from tofill those jobs. In some cases the jobs will be taken by previously unemployed locals orby someone who is currently employed locally but whose own job is taken by apreviously unemployed local. In both cases the impact of the newly created job andassociated income is partially offset by the fact that someone who was previouslyreceiving unemployment benefits for example is no longer doing so. To calculate thiseffect requires estimates of the parameter rho (see Appendix 2), the proportion ofnew jobs that are likely to be filled by previously unemployed locals. For theconstruction phase, it was estimated to be 90 per cent for the local area.Gross regional product (GRP)GRP is a measure of the net contribution of an activity or industry to the regional economy. Itrepresents payments to the primary inputs of production (labour, capital and land) and is aregional level equivalent of gross domestic product. Estimates for the 1-year constructionperiod are provided in Table 7.2 for Scenarios 2 to 4. The total contribution to GRP as a resultof the construction expenditure to upgrade the <strong>Kingscote</strong> <strong>Airport</strong> was almost $270,000 forScenario 2, $1.4m for Scenario 3 and almost $3.9m for Scenario 4 (Table 7.2).In 2011/12 <strong>Kangaroo</strong> <strong>Island</strong> GRP was approximately $217m (Table 4.2). On this basis, theprojected GRP total impact would boost the region’s total by around 0.1 per cent for Scenario2, 0.7 per cent for Scenario 3 and 1.8 per cent for Scenario 4.Table 7.2Economic Impact of the <strong>Kingscote</strong> <strong>Airport</strong> upgrade options, construction phaseScenario 2 Scenario 3 Scenario 4GRP ($m)Direct 0.152 0.716 1.922Flow-on 0.118 0.697 1.953Total 0.270 1.413 3.875Employment (fte)Direct 2 11 32Flow-on 1 6 16Total 3 17 47Source: EconSearch analysise c o n s e a r c hPage| 27
<strong>Kangaroo</strong> <strong>Island</strong> Futures Authority Draft Economic Impact of Agriculture and TourismEmployment (fte)Employment is a key indicator of both regional economic activity and the welfare of regionalhouseholds. The estimates presented in Table 7.2 show that direct employment on <strong>Kangaroo</strong><strong>Island</strong> is expected to be 2 fte for Scenario 2, 11 fte for Scenario 3 and 32 fte for Scenario 4.Including indirect effects (impacts on local businesses and service organisations) theemployment effect is projected to be 3 fte for Scenario 2, 17 fte for Scenario 3 and 47 fte forScenario 4.Fte employment in the region was 2,330 in 2011/12 (Table 4.1). On that basis, the projectedemployment impact would boost the region’s total by around 0.1 per cent for Scenario 2, 0.7per cent for Scenario 3 and 2.0 per cent for Scenario 4.ConclusionClearly, the construction impacts of any major project on <strong>Kangaroo</strong> <strong>Island</strong> are going to berelatively small given the limited capacity of businesses on the <strong>Island</strong> to provide the requiredproducts and services at the scale demanded. Here projects ranging from $9.8m (Scenario 2)to $37.1m (Scenario 4) are expected to result in local (<strong>Kangaroo</strong> <strong>Island</strong>) expenditure of from 5per cent ($0.5m in the case of Scenario 2) to 17 per cent ($6.4m, Scenario 4) of total projectoutlays. A similar outcome can be envisaged for projects such as water and power upgradesand the construction of major tourism accommodation.7.1.1.2 Operating PhaseThe annual operating and maintenance expenditure associated with each Scenario is detailedin Table 7.3. Scenario 1 maintenance costs were sourced by Tonkin Consulting from the<strong>Kangaroo</strong> <strong>Island</strong> Council and are the current budget to maintain the airport since this option issimply to maintain <strong>Kingscote</strong> <strong>Airport</strong> on an as-is basis without any deterioration in runway orpavement grade. Operating and maintenance costs for the other 3 scenarios were estimatedby Tonkin Consulting (Tonkin Consulting 2012). It has been assumed that all of these costs (100per cent) will occur in the <strong>Island</strong>.Table 7.3<strong>Kingscote</strong> <strong>Airport</strong> upgrade annual operating and maintenance expenditureScenario 1 Scenario 2 Scenario 3 Scenario 4MaintenanceRunway Pavements 11,500 12,800 16,200 26,300Apron Pavements 2,500 2,700 2,700 3,000Stormwater 2,000 3,000 3,000 3,000Terminal 37,500 151,000 162,500 306,900Lighting 0 5,000 6,800 8,100Security Sceening costsPersonnel 0 700,000 700,000 700,000Equipment servicing etc 0 100,000 100,000 100,000Total 53,500 974,500 991,200 1,147,300Source: Tonkin Consulting 2012Gross regional product (GRP)Estimates of GRP for the operating phase are provided in Table 7.4 for all scenarios. The totalannual contribution to GRP as a result of the operation of the <strong>Kingscote</strong> <strong>Airport</strong> was $37,000for Scenario 1, $620,000 for Scenario 2, $631,000 for Scenario 3 and $731,000 for Scenario 4(Table 7.4).e c o n s e a r c hPage| 28
<strong>Kangaroo</strong> <strong>Island</strong> Futures Authority Draft Economic Impact of Agriculture and TourismIn 2011/12 <strong>Kangaroo</strong> <strong>Island</strong> GRP was approximately $217m (Table 4.2). On this basis, theprojected GRP total impact would boost the region’s total by a minimal amount under Scenario1 and 0.3 per cent per annum for scenarios 2, 3 and 4.Table 7.4Economic Impact of the <strong>Kingscote</strong> <strong>Airport</strong> upgrade options, operation phaseScenario 1 Scenario 2 Scenario 3 Scenario 4GRP ($m)Direct 0.019 0.404 0.410 0.464Flow-on 0.018 0.216 0.221 0.267Total 0.037 0.620 0.631 0.731Employment (fte)Direct 0 7 7 7Flow-on 0 2 2 2Total 0 8 9 9Source: EconSearch analysisEmployment (fte)...The estimates presented in Table 7.4 show that direct employment on <strong>Kangaroo</strong> <strong>Island</strong> isexpected to be less than 1 fte for Scenario 1 and 7 fte for Scenarios 2, 3 and 4. Includingindirect effects (impacts on local businesses and service organisations) the employment effectis projected to be less than 1 fte for Scenario 1, 8 fte for Scenario 2and 9 fte for Scenarios 3and 4 (Table 7.4).Fte employment in the region was 2,330 in 2011/12 (Table 4.1). On that basis, the projectedemployment impact would boost the region’s total by minimal amount under Scenario 1 and0.4 per cent for scenarios 2, 3 and 4.ConclusionAnnual operating and maintenance expenditures for each scenario are relatively modestranging from about $54,000 to about $1.15m per annum. Despite the fact that 100 per cent ofthis expenditure is likely to stay in the <strong>Kangaroo</strong> <strong>Island</strong> economy as opposed to 5 – 17 per centin the construction stage, the impact on GRP of operating and maintenance expenditure is onlyestimated to be a maximum of 0.3 per cent of the regional total.It is difficult to make a case for the investment of public funds in an upgrade to the <strong>Kingscote</strong><strong>Airport</strong> that is based solely on the positive impacts to the <strong>Kangaroo</strong> <strong>Island</strong> GRP and localemployment as a result of the direct investment in construction, operating and maintenance.However, the impact on the <strong>Kangaroo</strong> <strong>Island</strong> economy of an upgrade to the <strong>Kingscote</strong> <strong>Airport</strong>is not limited to the economic activity that results from the direct expenditure on the upgradeproject alone.The upgrade of the <strong>Kingscote</strong> <strong>Airport</strong> can be considered a milestone investment fordevelopment in other industries and in particular for tourism on <strong>Kangaroo</strong> <strong>Island</strong>. Theeconomic impact of potential future scenarios for <strong>Kangaroo</strong> <strong>Island</strong> tourism that include growthin visitation linked to the availability and cost of access to the <strong>Island</strong> should also be taken intoaccount when considering the economic and social impacts of an upgrade to the <strong>Kingscote</strong>airport.e c o n s e a r c hPage| 29
<strong>Kangaroo</strong> <strong>Island</strong> Futures Authority Draft Economic Impact of Agriculture and Tourism7.1.2 Drivers of tourism growthAs noted in the introduction to this report, it was considered important in undertaking thisstudy to determine whether the scenarios and the targets for growth were ‘realistic’. Thefollowing sub-section provides a discussion of opportunities and potential growth scenariosthat arose out of consultation undertaken as part of the project. This is followed by estimatesof the economic impact of low, medium and high growth scenarios.In addition to the baseline (Section 5), three scenarios have been developed for testing usingthe RISE model. They are:1. low growth scenario2. moderate growth scenario3. high growth scenarioEach of the growth scenarios relate to the 8 year period from 2011/12 to 2019/20Baseline for 2011/ 2012The baseline has been developed using the following data (refer to Table 5.1 and Table 7.5):1. Total number of visitors: 194,000 (based on TOMM data 2011/12)2. Total number of visitor nights 4 : 658,000 (based on IVS / NVS (TRA data) ratio of visitorcategory to length of stay)3. Total visitor expenditure: $123m (based on IVS /NVS (TRA data) dollar value ofexpenditure per visitor in each visitor category)4. Average length of stay (visitor nights): domestic day 1.0, domestic overnight 4.3,international 3.1, giving a weighted average across all visitor categories of 3.4 nights.Low growth scenarioThe low growth scenario reflects the average annual growth rate for tourism in South Australiaof 2.55 per cent.(from 2002 to 2011) reported in the South Australia’s Strategic Plan ProgressReport 2012.The low growth model represents the following scenario (Table 7.5 summarises the changefrom baseline):1. Total number of visitors: 234,0002. Total number of visitor nights: 807,0003. Total visitor expenditure: $151m4For the purpose of this analysis one domestic day trip is counted as a ‘visitor night’.e c o n s e a r c hPage| 30
<strong>Kangaroo</strong> <strong>Island</strong> Futures Authority Draft Economic Impact of Agriculture and Tourism4. Growth in visitor expenditure of about 23 per cent between 2011/12 and 2019/20 (8years)Moderate growth scenarioThe moderate growth scenario is consistent with the target of $180m of ‘visitor worth’ / visitorexpenditure by 2020 set by the South Australian Government in the South Australian StrategicPlan. This objective is reinforced in the Destination Action Plan for <strong>Kangaroo</strong> <strong>Island</strong> 2012/14that cites important work by BDA Marketing Planning from TRA/NVS/IVS/Access Economics,2011.The moderate growth scenario will produce the following outcomes (Table 7.5 summarises thechange from baseline):1. Total number of visitors: 275,0002. Total number of visitor nights: 955,0003. Total visitor expenditure: $180m4. Growth in visitor expenditure of about 46 per cent between 2011/12 and 2019/20 (8years)Table 7.5Summary of the tourism low, moderate and high growth scenariosBaseline Low Growth Moderate Growth High Growth(2011/12) Change from Change from Change from%%baselinebaselinebaseline%Domestic day visitors:Visitors ('000) 39.6 0.0 0% 0.0 0% 0.0 0%Nights/visitor (no.) 1.0 0.0 0% 0.0 0% 0.0 0%Expenditure ($m) 3.3 0.0 0% 0.0 0% 0.0 0%Domestic overnight visitors:Visitors ('000) 114.0 18.2 16% 36.5 32% 36.5 32%Nights/visitor (no.) 4.3 0.0 0% 0.0 0% 1.0 23%Expenditure ($m) 95.6 15.3 16% 30.6 32% 59.9 63%International visitors:Visitors ('000) 40.4 22.3 55% 44.5 110% 44.5 110%Nights/visitor (no.) 3.1 0.0 0% 0.0 0% 1.0 32%Expenditure ($m) 24.0 13.2 55% 26.4 110% 42.5 177%Total visitors:Visitors ('000) 194.0 40.5 21% 81.0 42% 81.0 42%Nights/visitor (no.) 3.4 0.0 0% 0.0 0% 0.8 23%Expenditure ($m) 122.9 28.5 23% 57.0 46% 102.4 83%High growth scenarioThe high growth scenario builds on the target of $180m of ‘visitor worth’ / visitor expenditurein the South Australian Strategic Plan (the moderate growth scenario) by introducing a longerstay factor (stay an extra day) for domestic overnight and international visitors.e c o n s e a r c hPage| 31
<strong>Kangaroo</strong> <strong>Island</strong> Futures Authority Draft Economic Impact of Agriculture and TourismThe high growth scenario will produce the following outcomes (Table 7.5 summarises thechange from baseline):1. Total number of visitors: 275,0002. Total number of visitor nights: 1,191,0003. Total visitor expenditure: $225m4. Growth in visitor expenditure of about 83 per cent between 2011/12 and 2019/20 (8years)Assumptions about achieving growth 5The variables that combine to determine the contribution of the tourism industry to the<strong>Kangaroo</strong> <strong>Island</strong> economy are identified as:1. the number of visitors2. the proportion of visitors that are domestic intrastate, domestic intrastate andinternational (visitor profile)3. the yield (in dollars) of visitors in each category of the visitor profile4. the length of stay for visitors5. the percentage of visitor yield that is returned to the <strong>Kangaroo</strong> <strong>Island</strong> economyThe low and moderate growth scenarios are based on the following assumptions:1. there will be no change in the day visitor growth rate to 2019/202. there will be an increases in the domestic overnight and international visitor growthrate to 2019/203. there will be no change in the yield per visitor in each category of the visitor profile4. there will be no change to the length of stay for each visitor profile to 2019/205. there will be no change in the visitor yield that is returned to the <strong>Kangaroo</strong> <strong>Island</strong>economyThe high growth scenario mirrors the moderate growth scenario for all variables except thelength of stay (variable 4) which is extended by one day for each of the domestic overnight andinternational visitors.The rationale for these assumptions follows:5See Appendix 9 for notes on tourism data.e c o n s e a r c hPage| 32
<strong>Kangaroo</strong> <strong>Island</strong> Futures Authority Draft Economic Impact of Agriculture and Tourism1. Day visitor growth rates are linked to a reasonably narrow tourism experience. Theitinerary includes marshalling time, travel to / from the <strong>Island</strong> and travel around the<strong>Island</strong> as a fixed component. Limitations on access to high value experiences that canbe included in such an itinerary appear to be a natural growth inhibitor. Growth in dayvisitor rates have therefore been ignored for the purposes of building scenarios in thisstudy however it is noted that some additional growth is likely in this sector as a resultof innovation in scheduling and management for example.2. The main thrust of policy based strategies to grow visitation to <strong>Kangaroo</strong> <strong>Island</strong>appears to be targeted at increasing domestic extended stay and internationalvisitation. This is reflected strongly in regional, state and commonwealth tourismpolicy and current or recent program, planning and research initiatives that wereconsidered. Stakeholder consultation reinforced the potential of using this strategy.3. The decision to develop the low and moderate growth scenarios withoutconsideration of increased yield per visitor, increasing the length of stay per visitor orincreasing the yield returned to the local economy was made in order to focusattention on the economic impact of a change to the single variable of increasing thedomestic overnight and international visitation. This approach reduces the risk thatchange in one variable will mask the impact of another. However, it is noted thatthere are active programs to increase the length of stay per overnight visitor to<strong>Kangaroo</strong> <strong>Island</strong> (‘stay one more day’ program) and promoting local product(increasing return to the local economy). For this reason the high growth scenario wasdeveloped to be identical to the moderate growth scenario with the exception thatthe average length of stay increases by one day for both domestic overnight andinternational visitors. The net effect is to increase the average length of stay of allvisitors by 0.8 days from the baseline 3.4 days to 4.2 days (Table 7.5).7.1.3 Economic contribution of tourism - low growth scenarioThe low growth scenario for tourism would deliver an increase in the number of visitors on<strong>Kangaroo</strong> <strong>Island</strong> to around 234,000 persons per annum (domestic overnight and international).From the discussion of market opportunity (Appendix 5) this level of market development isconsidered a relatively low-level growth outcome that could be expected to be realised withinan 8-year period. By year 8 it would equate to an additional 40,000 visitors to <strong>Kangaroo</strong> <strong>Island</strong>each year.In current dollar terms, total tourism expenditure on the <strong>Island</strong> corresponding with this higherlevel of visitation would be approximately $151m, an additional $28m per annum over theestimate for 2011/12, which is equivalent to an average rate of growth in expenditure of 2.6per cent per annum over an 8-year period. This is marginally higher than trend and consideredrealistic.In aggregate, it was estimated that the increase in visitor expenditure would generate thefollowing economic activity on <strong>Kangaroo</strong> <strong>Island</strong> (Table 7.6):• approximately $12 million in GRP (6 per cent increase);• approximately 128 full-time and part-time jobs (5 per cent increase); and• approximately 107 fte jobs (5 per cent increase).e c o n s e a r c hPage| 33
<strong>Kangaroo</strong> <strong>Island</strong> Futures Authority Draft Economic Impact of Agriculture and TourismTable 7.6abcEconomic impact of tourism expenditure growth: low growth scenarioTourismExpenditure a GRP Impact Employment Impact$m $m fte Total JobsWine and other food products 0.3 0.2 2 2Wholesale trade 0.4 0.5 4 4Retail trade 2.5 1.8 28 35Accommodation and food services 7.9 3.8 45 59Transport 1.3 0.8 7 6Ownership of dwellings 1.1 1.4 0 0Property and business services 0.3 1.0 9 9Education 0.0 0.1 1 1Health and community services 0.0 0.1 2 2Cultural and recreational services 0.4 0.2 3 2Personal services 0.0 0.1 2 3Other sectors 0.0 0.7 5 5Net Taxes b 1.5 1.5 - -Imports 12.8 - - -Total Tourism Impact 28.5 12.2 107 128Regional Total c - 217.0 2,330 2,399Tourism Contribution to RegionalGrowth- 6% 5% 5%In basic prices, that is, net of net taxes (taxes minus subsidies) and marketing and transport margins. Furtherdescription of the method used to estimate this profile of tourism expenditure is provided in Section 2.2.Indirect taxes (principally GST) less subsidies.Derived from the <strong>Kangaroo</strong> <strong>Island</strong> RISE model for 2011/12.Source: EconSearch analysis7.1.4 Economic contribution of tourism - moderate scenarioGiven an upgrade of the <strong>Kingscote</strong> <strong>Airport</strong> (Scenario 3, Section 7.1.1), SATC estimated thatthere is the potential to increase the number of visitors on <strong>Kangaroo</strong> <strong>Island</strong> to around 275,000persons per annum (domestic overnight and international).From the discussions with stakeholders of market opportunity (Appendix 5), this level ofmarket development is considered a moderate-level growth scenario that could be expectedto be realised within an eight-year period. By year 8 it would equate to an additional 81,000visitors each year.In 2012 dollar terms, total tourism expenditure on the <strong>Island</strong> corresponding with this higherlevel of visitation would be approximately $180m, an additional $57m per annum over theestimate for 2011/12, which is equivalent to an average rate of growth in expenditure of 4.9per cent per annum.According to SATC, this latent demand for tourism on <strong>Kangaroo</strong> <strong>Island</strong> is consistent with ananalysis of Uluru as a benchmark for <strong>Kangaroo</strong> <strong>Island</strong>. Uluru has a range of similarities to<strong>Kangaroo</strong> <strong>Island</strong> including:• High consideratione c o n s e a r c hPage| 34
<strong>Kangaroo</strong> <strong>Island</strong> Futures Authority Draft Economic Impact of Agriculture and Tourism• High proportion of international visitors• Iconic status• Natural attraction• Significant access issues, which have been partially overcome with frequent directflights from capital cities.In aggregate, it was estimated that the increase in visitor expenditure would generate thefollowing economic activity on <strong>Kangaroo</strong> <strong>Island</strong> (Table 7.7):• Approximately $23 million in GRP (11 per cent increase)• Approximately 239 full-time and part-time jobs (9 per cent increase)• Approximately 198 fte jobs (11 per cent increase)Table 7.7abcEconomic impact of tourism expenditure growth: moderate growth scenarioTourismExpenditure a GRP Impact Employment Impact$m $m fte Total JobsWine and other food products 0.6 0.5 4 5Wholesale trade 0.9 1.1 8 7Retail trade 5.0 3.6 57 69Accommodation and food services 15.8 7.7 89 118Transport 2.6 1.5 13 11Ownership of Dwellings 2.3 2.7 0 0Property and business services 0.6 2.0 17 19Education 0.0 0.2 2 2Health and community services 0.0 0.2 3 4Cultural and recreational services 0.8 0.4 5 5Personal Services 0.0 0.3 5 6Other Sectors 0.0 1.4 9 10Net Taxes b 2.9 2.9 - -Imports 25.6 - - -Total (Tourism) 57.0 24.4 213 256Regional Total c - 217.0 2,330 2,399Tourism Contribution to Regional Total - 11% 9% 11%In basic prices, that is, net of net taxes (taxes minus subsidies) and marketing and transport margins. Furtherdescription of the method used to estimate this profile of tourism expenditure is provided in Section 2.2.Indirect taxes (principally GST) less subsidies.Derived from the <strong>Kangaroo</strong> <strong>Island</strong> RISE model for 2011/12.Source: EconSearch analysise c o n s e a r c hPage| 35
<strong>Kangaroo</strong> <strong>Island</strong> Futures Authority Draft Economic Impact of Agriculture and Tourism7.1.5 Economic contribution of tourism – high growth scenarioAs noted above, the high growth scenario was developed to mirror the moderate growthscenario with the exception that the average length of stay for both domestic overnight andinternational visitors is assumed to increase by one day.This means that the average length of stay would increase from 4.3 to 5.3 days for all domesticovernight visitors and from 3.1 to 4.1 days for international visitors. This equates to anincrease in the average weighted length of stay across all visitors (including day trippers) of 0.8days from the baseline 3.4 days to 4.2 days.In aggregate, it was estimated that the increase in visitor expenditure under the high growthscenario would generate the following economic activity on <strong>Kangaroo</strong> <strong>Island</strong>, compared withthe baseline, (Table 7.7):• Approximately $49 million in GRP (23 per cent increase);• Approximately 4593 full-time and part-time jobs (19 per cent increase); and• Approximately 383 fte jobs (16 per cent increase).Table 7.8abcEconomic impact of tourism expenditure growth: high growth scenarioTourismExpenditure a GRP Impact Employment Impact$m $m fte Total JobsWine and other food products 1.0 0.8 8 8Wholesale trade 1.6 1.9 14 13Retail trade 8.9 6.5 102 125Accommodation and food services 28.2 13.8 160 212Transport 4.6 2.7 24 20Ownership of Dwellings 4.1 4.9 0 0Property and business services 1.1 3.6 31 34Education 0.0 0.3 4 4Health and community services 0.0 0.4 6 7Cultural and recreational services 1.4 0.7 10 9Personal Services 0.1 0.5 9 10Other Sectors 0.0 8.0 17 17Net Taxes b 5.3 5.3 - -Imports 45.9 - - -Total (Tourism) 102.4 49.4 383 459Regional Total c - 217 2,330 2,399Tourism Contribution to Regional Total - 23% 16% 19%In basic prices, that is, net of net taxes (taxes minus subsidies) and marketing and transport margins. Furtherdescription of the method used to estimate this profile of tourism expenditure is provided in Section 2.2.Indirect taxes (principally GST) less subsidies.Derived from the <strong>Kangaroo</strong> <strong>Island</strong> RISE model for 2011/12.Source: EconSearch analysise c o n s e a r c hPage| 36
<strong>Kangaroo</strong> <strong>Island</strong> Futures Authority Draft Economic Impact of Agriculture and Tourism7.1.6 SummaryThe low growth scenario for tourism growth would deliver 2.6 per cent growth over 8 yearswhich is marginally above trend. It should be noted that this low scenario includes arequirement to lift the capacity of air transport to accommodate the growth particularly ininternational visitors. The milestone development investigated in this study is an upgrade tothe <strong>Kingscote</strong> <strong>Airport</strong> in the short to medium term.The impact of this growth would be an increase in <strong>Kangaroo</strong> <strong>Island</strong> GRP of about 6 per centwhich is particularly significant given the contribution of tourism to the <strong>Kangaroo</strong> <strong>Island</strong>economy is about 25 per cent of GRP. This implies that the tourism industry will grow by about23 per cent over the 8-year time period.The moderate growth scenario for tourism would deliver 4.9 per cent per annum growth over8 years which is that required to meet the target of $180m of visitor expenditure set in theSASP. This study includes consideration of the milestone development of an upgrade to the<strong>Kingscote</strong> <strong>Airport</strong> in the short to middle term).The impact of this growth (46 per cent over the time period) would be an increase in the GRPof about 11 per cent, fte jobs growth of 9 per cent and total jobs growth of 11 per cent.The high growth scenario for tourism growth would deliver 7.9 per cent per annum growthover eight years (83 per cent over the period) which could be considered in line with the SAEconomic Development Board’s target of doubling visitor expenditure over the eight yearperiod.The impact of this growth would be an increase in the GRP of about 23 per cent which isparticularly significant given the contribution of tourism to the <strong>Kangaroo</strong> <strong>Island</strong> economy.It is acknowledged that the original Economic Development Board target (Paradise Girt by Sea2010) spoke in terms of doubling visitor numbers but this is not meaningful given anticipatedchanges to the visitor profile including intrastate, interstate and international visitation.7.2 Agriculture7.2.1 Drivers of agricultural industry growthFour specific drivers of future growth were identified in the data and literature review and thesubsequent industry consultation and information synthesis process.Increase in productivity, reduced costs (e.g. improved logistics) branding premium and changein land use are all factors that, by themselves and in combination, will provide the stimulus forgrowth in the agricultural sector on <strong>Kangaroo</strong> <strong>Island</strong> over the next decade. Table 7.9 shows therange (low, moderate and high) in expected growth of these parameters over the currenttrend for the 8 year period to 2019/20.e c o n s e a r c hPage| 37
<strong>Kangaroo</strong> <strong>Island</strong> Futures Authority Draft Economic Impact of Agriculture and TourismTable 7.9 Drivers of economic growth: 8 years to 2019/20Growth Driver Low Medium HighIncrease in production (productivity) 15% 25% 50%Reduced costs (improved logistics) 5% 10% 20%Branding premium 5% 10% 20%Change in landuse (hort & oth ag) 25% 70% 140%Source: EconSearch analysis and industry consultationOpportunities for increases in productivity were discussed during consultation. Examples ofsignificant improvement over the past decade were highlighted where, in the sheep industryfor example, a combination of technology (e.g. consideration of genetics in breedingprograms) and management practices to improve productivity and product quality has yieldedsubstantial improvements in both production (over 50 per cent demonstrated) and financialreturns.Opportunities for reduced costs, such as through improved logistics, have been realised byproducers in various agricultural industries in recent years. There are recognised opportunitiesto develop cooperative practices to approach transport carriers across the supply chain (e.g.transport companies, access providers in sea and air, storage / warehousing distribution,retailing). Because transport costs are a much larger proportion of total operating costscompared with businesses a similar distance from Adelaide (see Appendix 9), innovativesolutions that deliver improved logistics have the potential to drive economic growth on the<strong>Island</strong>.The potential to capture a branding premium was identified by many of those consulted, bothin agriculture and tourism. For any particular product or commodity this will require:• the development of a brand consortia and agreement on brand managementprotocols• the promotion of Brand <strong>Kangaroo</strong> <strong>Island</strong> in mainland markets• (iii) alignment of the brand with other activities on <strong>Kangaroo</strong> <strong>Island</strong> (in particular,community buy in).A well-funded and properly accredited branding program has the capacity to generate asignificant price premium to program participants and thereby contribute to local economicgrowth.The potential for change in land use to more intensive production systems (e.g. from grazing tohorticulture and viticulture) was shown to be relatively unconstrained by land suitabilityfactors (ref PIRSA mapping). In some instances there are water availability constraints and inothers land use change may require appropriate amendments in land use planning linked toresource management through Water and Environmental Management Plans for example.Nevertheless, with currently very low levels of horticulture and viticulture production, thepotential for significant growth, at least in relative terms, is apparent.7.2.2 Economic contribution of agriculture – low growth scenarioThe impacts of the low growth scenario are detailed on a sector-by-sector basis in Table 7.10and summarised below:e c o n s e a r c hPage| 38
<strong>Kangaroo</strong> <strong>Island</strong> Futures Authority Draft Economic Impact of Agriculture and Tourism• Increase farm gate gross value of production (GVP) by almost $15m• Increase direct gross regional product (GRP) by $5.2mTable 7.10 Agricultural impact: low growth scenario, 8 years to 2019/20Value of Output b Gross regionalproductEmployment$m $m fteDirect ImpactAgriculture 14.8 7.1 57Processing 0.9 0.3 1Retail 0.4 0.1 2Food services 0.3 0.1 1Total Direct Impact 16.5 7.6 61Flow-on ImpactServices to agriculture 0.3 2Other manufacturing 0.0 1Wholesale trade 0.5 3Retail trade 0.4 6Accommodation and food services 0.2 3Transport and storage 0.3 2Finance and insurance 0.3 1Ownership of dwellings 0.5 0Property and business services 0.5 4Education 0.1 1Health and community services 0.1 2Personal services 0.1 2Other sectors 0.8 14Total Flow-on Impact 4.0 42Total Impact 11.7 103Regional total 216.8 2,330Proportion of regional total 5% 4%Source: EconSearch analysisWith the aid to the <strong>Kangaroo</strong> <strong>Island</strong> RISE model, the economy wide impacts of the agriculturallow growth scenario were estimated showing, in summary an increase in direct and flow-on:• GRP of approximately $11.7 million (5 per cent growth on 2011/12); and• full-time equivalent (fte) employment of 103 fte jobs (4 per cent growth on 2011/12).7.2.3 Economic contribution of agriculture – moderate growth scenarioThe impacts of the moderate growth scenario are detailed on a commodity-by-commoditybasis in Table 7.11 and summarised below:• Increase farm gate gross value of production (GVP) by $24.6m (35 per cent)• Increase direct gross regional product (GRP) by $15.8m (51 per cent)e c o n s e a r c hPage| 39
<strong>Kangaroo</strong> <strong>Island</strong> Futures Authority Draft Economic Impact of Agriculture and TourismTable 7.11 Agricultural impact: moderate growth scenario, 8 years to 2019/20Value of Output b Gross regionalproductEmployment$m $m fteDirect ImpactAgriculture 27.8 14.2 100Processing 1.6 0.6 1Retail 0.8 0.3 4Food services 0.5 0.2 1Total Direct Impact 30.7 15.3 107Flow-on ImpactServices to agriculture 0.5 3Other manufacturing -0.2 2Wholesale trade 0.8 6Retail trade 0.7 11Accommodation and food services 0.3 5Transport and storage 0.4 4Finance and insurance 0.6 1Ownership of dwellings 0.9 0Property and business services 0.8 7Education 0.1 2Health and community services 0.2 3Personal services 0.2 4Other sectors 1.5 25Total Flow-on Impact 7.0 74Total Impact 22.3 181Regional total 216.8 2,330Proportion of regional total 10% 8%Source: EconSearch analysisWith the aid to the <strong>Kangaroo</strong> <strong>Island</strong> RISE model, the economy wide impacts of the agriculturalmoderate growth scenario were estimated showing, in summary an increase in direct andflow-on:• GRP of approximately $22.3 million (10 per cent growth on 2011/12); and• full-time equivalent (fte) employment of 181 fte jobs (8 per cent growth on 2011/12).7.2.4 Economic contribution of agriculture – high growth scenarioThe impacts of the high growth scenario are detailed on a commodity-by-commodity basis inTable 7.12 and summarised below:• Increase in farm gate GVP by $64m (93 per cent)• Increase in direct GRP by $31m (102 per cent)e c o n s e a r c hPage| 40
<strong>Kangaroo</strong> <strong>Island</strong> Futures Authority Draft Economic Impact of Agriculture and TourismTable 7.12 Agricultural impact: high growth scenario, 8 years to 2019/20Value of Output b Gross regionalproductEmployment$m $m fteDirect ImpactAgriculture 55.6 28.5 201Processing 3.3 1.1 3Retail 1.6 0.5 7Food services 1.1 0.4 3Total Direct Impact 61.4 30.5 213Flow-on ImpactServices to agriculture 1.1 7Other manufacturing 0.3 5Wholesale trade 1.7 12Retail trade 1.3 22Accommodation and food services 0.7 10Transport and storage 0.9 9Finance and insurance 1.2 3Ownership of dwellings 1.8 0Property and business services 1.7 15Education 0.2 3Health and community services 0.4 6Personal services 0.4 8Other sectors 2.4 51Total Flow-on Impact 14.1 149Total Impact 44.6 362Regional total 216.8 2,330Proportion of regional total 21% 16%Source: EconSearch analysisThe economy wide impacts of the agricultural high growth scenario were estimated using the<strong>Kangaroo</strong> <strong>Island</strong> RISE model showing, in summary, an increase in direct and flow-on:• GRP of approximately $44.6 million (21 per cent increase on 2011/12)• fte employment of 362 (16 per cent increase on 2011/12)7.2.5 SummaryThe low growth scenario for the agricultural industry would result in 2.6 per cent growth overeight years. This outcome is a combination of a low level improvement in the four mainpotential drivers of economic growth, namely technical productivity (e.g. yield/hectare),operating costs (e.g. logistics), premium brand (e.g. Brand <strong>Kangaroo</strong> <strong>Island</strong>) and change in landuse (e.g. switch to more intensive production systems).The impact of this growth would be an increase in <strong>Kangaroo</strong> <strong>Island</strong> GRP of about 5 per centwhich is significant given the contribution of agriculture to the <strong>Kangaroo</strong> <strong>Island</strong> economy isabout 27 per cent of GRP. This implies that the contribution of the agriculture industry willgrow by about 17 per cent over the 8-year time period.e c o n s e a r c hPage| 41
<strong>Kangaroo</strong> <strong>Island</strong> Futures Authority Draft Economic Impact of Agriculture and TourismThe moderate and high growth scenarios would require relatively higher levels ofimprovement in the four potential driversThe moderate growth scenario for agriculture would deliver 4.5 per cent per annum growthover eight years. The impact of this growth (42 per cent over the time period) would be anincrease in the GRP of about 10 per cent (above the 2011/12 level) and fte jobs growth of 8 percent.The high growth scenario for agriculture would deliver 7.9 per cent per annum growth overeight years (83 per cent over the period) which could be considered in line with the SAEconomic Development Board’s target of doubling farm gate production over the eight yearperiod.The impact of this growth would be an increase in the GRP of about 17 per cent (above the2011/12 level) and fte jobs growth of 12 per cent.e c o n s e a r c hPage| 42
<strong>Kangaroo</strong> <strong>Island</strong> Futures Authority Draft Economic Impact of Agriculture and TourismREFERENCESAustralian Bureau of Statistics (ABS) 2011a, 2009/10 Household Expenditure Survey Summaryof Results, ABS Cat. No. 6530.0, Canberra, electronic version (and previous issues).Australian Bureau of Statistics 2011b, Australian National Accounts, Tourism Satellite Account,2010/11, ABS Cat. No. 5249.0, Canberra.Australian Bureau of Statistics 2012a, Regional Population Growth, Australia, ABS Cat. No.3218.0, Canberra.Australian Bureau of Statistics 2012b, Population by Age and Sex, Australia, 2010, Cat. No.3235.0, Canberra, AugustAustralian Bureau of Statistics 2012c, 2011Census of Population and Housing, Canberra.Australian Bureau of Statistics 2012d, 2011/12 Australian National Accounts, State Accounts,ABS Cat. No. 5220.0, Canberra.Australian Bureau of Statistics 2012e, Australian National Accounts: Input-Output Tables -Electronic Publication 2008/09, ABS Cat. No. 5209.0.55.001, Canberra.Australian Bureau of Statistics 2012f, Agricultural Commodities: Small Area Data, Australia,2010/11, ABS Cat. No. 7125.0, Canberra.Australian Bureau of Statistics 2012g, Value of Agricultural Commodities Produced, Australia,2010/11, ABS Cat. No. 7503.0, Canberra.Australian Taxation Office 2012, Taxation Statistics 2009/10, Table 3: Personal Tax, Selecteditems, by state/territory and postcode, for taxable individuals, 2009/10 income year.Colmar Brunton 2012, TOMM <strong>Kangaroo</strong> <strong>Island</strong> Committee, Visitor Exit Survey 2011/12, reportprepared for the TOMM Committee <strong>Kangaroo</strong> <strong>Island</strong>.Department of Employment and Workplace Relations (DEWR) 2012, Small Area LabourMarkets, Australia, June Quarter 2012 (and previous issues).EconSearch 2003, <strong>Kangaroo</strong> <strong>Island</strong> Sea Access Economic Assessment Study, prepared for the<strong>Kangaroo</strong> <strong>Island</strong> Development Board Inc.EconSearch 2007, <strong>Kangaroo</strong> <strong>Island</strong> Reduction in Transport Costs, a report prepared the<strong>Kangaroo</strong> <strong>Island</strong> Development Board Inc.EconSearch 2009, Input-Output Tables for South Australia and its Regions, 2006/07: TechnicalReport, report prepared for the Department of Trade and Economic Development, May.EconSearch 2010a, Local Input-Output Modelling of Victorian Primary Industries, reportprepared for the Department of Primary Industries (Victoria), June.EconSearch 2010b, User Notes for the RISE Version 3.0 Impact Model, report prepared for theDepartment of Primary Industries (Victoria), June.e c o n s e a r c hPage| 43
<strong>Kangaroo</strong> <strong>Island</strong> Futures Authority Draft Economic Impact of Agriculture and TourismJensen, R.C. 1980, 'The Concept of Accuracy in Input-Output Models', International RegionalScience Review 5(2), 139-54.Jensen, R.C. and West, G.R. 1986, Input-Output for Practitioners, Vol.1, Theory andApplications, Office of Local Government, Department of Local Government andAdministrative Services, AGPS, Canberra.KPMG 2012, Forestry and Managed Investment Schemes on <strong>Kangaroo</strong> <strong>Island</strong>: SituationalAnalysis, confidential draft, prepared for <strong>Kangaroo</strong> <strong>Island</strong> Futures Authority.Mangan, J. and Phibbs, P. 1989, Demo-Economic Input-Output Modelling with SpecialReference to the Wollongong Economy, Australian Regional Developments 20, AGPS,Canberra.Phylloxera Grape and Industry Board South Australia (PGIBSA) 2012, The South AustralianWinegrape Crush Survey.West, G.R. 2009, IO9 Users’ Guide and Reference, Part B (DRAFT), Department of Economics,University of Queensland, St Lucia.Tonkin Consulting 2012, <strong>Kingscote</strong> <strong>Airport</strong> Infrastructure Study Report, prepared for the<strong>Kangaroo</strong> <strong>Island</strong> Council, October.Tourism Research Australia 2012, Regional Tourism Profiles 2011/12, Canberra.DisclaimerWe have prepared the above report exclusively for the use and benefit of our client. Neitherthe firm nor any employee of the firm undertakes responsibility in any way whatsoever to anyperson (other than to the above mentioned client) in respect of the report including any errorsor omissions therein however caused.e c o n s e a r c hPage| 44
<strong>Kangaroo</strong> <strong>Island</strong> Futures Authority Draft Economic Impact of Agriculture and TourismAPPENDIX 1 INTERMEDIATE SECTORSPECIFICATIONAppendix Table 1.1Intermediate sector specifications for the input-output model<strong>Kangaroo</strong> <strong>Island</strong> Region(66 sectors)National I-O Table (2008/09)(111 sectors)1 Sheep 1 0101 Sheep, Grains, Beef and Dairy Cattle2 Grains3 Beef Cattle4 Dairy Cattle5 Pigs 2 0102 Poultry and Other Livestock6 Poultry7 Viticulture 3 0103 Other agriculture8 Vegetables8 Fruit and Nuts10 Other Agriculture13 Commercial fishing 4 0201 Aquaculture12 Forestry 5 0301 Forestry and logging13 Commercial fishing 6 0401 Fishing, hunting and trapping11 Services to agriculture 7 0501 Agriculture, Forestry and Fishing SupportServices14 Coal 8 0601 Coal mining15 Oil and gas 9 0701 Oil and gas extraction16 Iron and non-ferrous ores 10 0801 Iron ore mining11 0802 Non Ferrous Metal Ore Mining17 Other mining 12 0901 Non metallic mineral mining18 Services to mining 13 1001 Exploration and Mining Support Services19 Meat & meat products 14 1101 Meat & meat product manufacturing15 1102 Processed seafood manufacturing20 Dairy products 16 1103 Dairy product manufacturing21 Fruit & vegetable products 17 1104 Fruit and vegetable product manufacturing22 Oils & fat 18 2105 Oils and fats manufacturing23 Flour mill products and cereal foods 19 1106 Grain Mill and Cereal Product Manufacturinge c o n s e a r c hPage| 45
<strong>Kangaroo</strong> <strong>Island</strong> Futures Authority Draft Economic Impact of Agriculture and Tourism<strong>Kangaroo</strong> <strong>Island</strong> Region(66 sectors)National I-O Table (2008/09)(111 sectors)24 Other food products 20 1107 Bakery Product Manufacturing21 1108 Sugar & confectionary manufacturing22 1109 Other food product manufacturing26 Other beverages 23 1201 Soft drinks, cordials and syrup manufacturing24 1202 Beer manufacturing25 Wine 25 1205 Wine, spirits and tobacco27 Textiles, clothing & footwear 26 1301 Textile manufacturing27 1302 Tanned Leather, Dressed Fur and LeatherProduct Manufacturing28 1303 Textile Product Manufacturing29 1304 Knitted Product Manufacturing30 1305 Clothing Manufacturing31 1306 Footwear Manufacturing28 Sawmill products 32 1401 Sawmill product manufacturing29 Other wood products 33 1402 Other wood product manufacturing30 Pulp, paper & paperboard 34 1501 Pulp, paper & paperboard manufacturing31 Paper containers & products 35 1502 Paper Stationery and Other Converted PaperProduct Manufacturing32 Printing & services to printing 36 1601 Printing (including the reproduction of recordedmedia)34 Petrochemical & other chemical products 37 1701 Petroleum & coal product manufacturing38 1801 Human Pharmaceutical and Medicinal ProductManufacturing39 1802 Veterinary Pharmaceutical and MedicinalProduct Manufacturing40 1803 Basic Chemical Manufacturing41 1804 Cleaning Compounds and Toiletry PreparationManufacturing35 Non-metallic mineral products 42 1901 Polymer Product Manufacturing43 1902 Natural Rubber Product Manufacturing44 2001 Glass and Glass Product Manufacturing45 2002 Ceramic Product Manufacturing46 2003 Cement, Lime and Ready-Mixed ConcreteManufacturing47 2004 Plaster and Concrete Product Manufacturing48 2005 Other Non-Metallic Mineral ProductManufacturinge c o n s e a r c hPage| 46
<strong>Kangaroo</strong> <strong>Island</strong> Futures Authority Draft Economic Impact of Agriculture and Tourism<strong>Kangaroo</strong> <strong>Island</strong> Region(66 sectors)National I-O Table (2008/09)(111 sectors)36 Iron and steel 49 2010 Iron & steel Manufacturing37 Basic non-ferrous metals & products 50 2102 Basic Non-Ferrous Metal Manufacturing38 Metal products 51 2201 Forged Iron and Steel Product Manufacturing52 2202 Structural Metal Product Manufacturing53 2203 Metal Containers and Other Sheet Metal Productmanufacturing54 2204 Other Fabricated Metal Product manufacturing39 Motor vehicles & parts; other transport equip 55 2301 Motor Vehicles and Parts; Other TransportEquipment manufacturing40 Other machinery & equipment 56 2302 Ships and Boat Manufacturing57 2303 Railway Rolling Stock Manufacturing58 2304 Aircraft Manufacturing59 2401 Professional, Scientific, Computer and ElectronicEquipment Manufacturing60 2403 Electrical Equipment Manufacturing61 2404 Domestic Appliance Manufacturing62 2405 Specialised and other Machinery and EquipmentManufacturing41 Furniture 63 2501 Furniture manufacturing42 Other manufacturing 64 2502 Other Manufactured Products43 Electricity supply 65 2601 Electricity Generation44 Gas supply 67 2701 Gas supply66 2605 Electricity Transmission, Distribution, On Sellingand Electricity Market Operation45 Water supply, sewerage & drainage services 68 2801 Water supply, sewerage & drainage services69 2901 Waste Collection, Treatment and DisposalServices46 Residential building 70 3001 Residential building Construction47 Other construction 71 3002 Non-Residential Building Construction72 3101 Heavy and Civil Engineering Construction48 Construction trade services 73 3201 Construction Services49 Wholesale trade 74 3301 Wholesale trade50 Retail trade 75 3901 Retail trade51 Accommodation, cafes & restaurants 76 4401 Accommodation77 4501 Food and Beverage Servicese c o n s e a r c hPage| 47
<strong>Kangaroo</strong> <strong>Island</strong> Futures Authority Draft Economic Impact of Agriculture and Tourism<strong>Kangaroo</strong> <strong>Island</strong> Region(66 sectors)National I-O Table (2008/09)(111 sectors)52 Road transport 78 4601 Road transport53 Rail, pipeline & other transport 79 4701 Rail transport54 Water transport 80 4801 Water, Pipeline and Other Transport55 Air & space transport 81 4901 Air & space transport56 Services to transport; storage 82 5101 Postal and Courier Pick-up and Delivery Service83 5201 Transport Support services and storage33 Publishing, recorded media, etc. 84 5401 Publishing (except Internet and Music Publishing)57 Communication services 85 5501 Motion Picture and Sound Recording58 Finance & insurance 90 6201 Finance86 5601 Broadcasting (except Internet)87 5701 Internet Publishing and Broadcasting andServices Providers, Websearch Portals and DataProcessing Services88 5801 Telecommunication Services89 6001 Library and Other Information Services91 6301 Insurance and Superannuation Funds92 6401 Auxiliary Finance and Insurance Services59 Ownership of dwellings 93 6701 Ownership of dwellings60 Property & business services 94 6601 Rental and Hiring Services (except Real Estate)95 6702 Non-Residential Property Operators and RealEstate Services96 6901 Professional, Scientific and Technical Services.97 7001 Computer Systems Design and Related Services98 7201 Building Cleaning, Pest Control, Administrativeand Other Support Services61 Government administration 99 7501 Public Administration and Regulatory Services100 7701 Public Order and Safety62 Defence 101 7601 Defence63 Education 102 8001 Education and training64 Health & community services 103 8401 Health Care Services104 8601 Residential Care and Social Assistance Services65 Cultural & recreational services 105 8901 Heritage, Creative and Performing Arts106 9101 Sports and Recreation107 9201 Gamblinge c o n s e a r c hPage| 48
<strong>Kangaroo</strong> <strong>Island</strong> Futures Authority Draft Economic Impact of Agriculture and Tourism<strong>Kangaroo</strong> <strong>Island</strong> Region(66 sectors)National I-O Table (2008/09)(111 sectors)66 Personal services 108 9401 Automotive Repair and Maintenance109 9402 Other Repair and Maintenance110 9501 Personal Services111 9502 Other servicesSource:EconSearch analysis and ABS (2012e).e c o n s e a r c hPage| 49
<strong>Kangaroo</strong> <strong>Island</strong> Futures Authority Draft Economic Impact of Agriculture and TourismAPPENDIX 2 AN OVERVIEW OFECONOMIC IMPACT ANALYSIS USINGTHE INPUT-OUTPUT METHODEconomic impact analysis based on an input-output (I-O) model provides a comprehensiveeconomic framework that is extremely useful in the resource planning process. Broadly, thereare two ways in which the I-O method can be used.First, the I-O model provides a numerical picture of the size and shape of an economy and itsessential features. The I-O model can be used to describe some of the important features of aneconomy, the interrelationships between sectors and the relative importance of the individualsectors.Second, I-O analysis provides a standard approach for the estimation of the economic impactof a particular activity. The I-O model is used to calculate industry multipliers that can then beapplied to various development or change scenarios.The input-output databaseInput-output analysis, as an accounting system of inter-industry transactions, is based on thenotion that no industry exists in isolation. This assumes, within any economy, each firmdepends on the existence of other firms to purchase inputs from, or sell products to, forfurther processing. The firms also depend on final consumers of the product and labour inputsto production. An I-O database is a convenient way to illustrate the purchases and sales ofgoods and services taking place in an economy at a given point in time.As noted above, I-O models provide a numerical picture of the size and shape of the economy.Products produced in the economy are aggregated into a number of groups of industries andthe transactions between them recorded in the transactions table. The rows and columns ofthe I-O table can be interpreted in the following way:• The rows of the I-O table illustrate sales for intermediate usage (i.e. to other firms inthe region) and for final demand (e.g. household consumption, exports or capitalformation).• The columns of the I-O table illustrate purchases of intermediate inputs (i.e. fromother firms in the region), imported goods and services and purchases of primaryinputs (i.e. labour, land and capital).• Each item is shown as a purchase by one sector and a sale by another, thusconstructing two sides of a double accounting schedule.In summary, the I-O model can be used to describe some of the important features of a stateor regional economy, the interrelationships between sectors and the relative importance ofthe individual sectors. The model is also used for the calculation of sector multipliers and theestimation of economic impacts arising from some change in the economy.e c o n s e a r c hPage| 50
<strong>Kangaroo</strong> <strong>Island</strong> Futures Authority Draft Economic Impact of Agriculture and TourismUsing input-output analysis for estimation of economic impactsThe I-O model conceives the economy of the region as being divided up into a number ofsectors and this allows the analyst to trace expenditure flows. To illustrate this, consider theexample of a vineyard that, in the course of its operation, purchases goods and services fromother sectors. These goods and services would include fertiliser, chemicals, transport services,and, of course, labour. The direct employment created by the vineyard is regarded in themodel as an expenditure flow into the household sector, which is one of several non-industrialsectors recognised in the I-O model.Upon receiving expenditure by the vineyard, the other sectors in the regional economy engagein their own expenditures. For example, as a consequence of winning a contract for work withvineyard, a spraying contractor buys materials from its suppliers and labour from its ownemployees. Suppliers and employees in turn engage in further expenditure, and so on. Theseindirect and induced (or flow-on) effects6, as they are called, are part of the impact of thevineyard on the regional economy. They must be added to the direct effects (which areexpenditures made in immediate support of the vineyard itself) in order to arrive at a measureof the total impact of the vineyard.It may be thought that these flow-on effects (or impacts) go on indefinitely and that theiramount adds up without limit. The presence of leakages, however, prevents this fromoccurring. In the context of the impact on a regional economy, an important leakage isexpenditure on imports, that is, products or services that originate from outside the region,state or country (e.g. machinery).Thus, some of the expenditure by the vineyard (i.e. expenditure on imports to the region) islost to the regional economy. Consequently, the flow-on effects get smaller and smaller insuccessive expenditure rounds due to this and other leakages. Hence the total expenditurecreated in the regional economy is limited in amount, and so (in principle) it can be measured.Using I-O analysis for estimation of regional economic impacts requires a great deal ofinformation. The analyst needs to know the magnitude of various expenditures and wherethey occur. Also needed is information on how the sectors receiving this expenditure sharetheir expenditures among the various sectors from whom they buy, and so on, for the furtherexpenditure rounds.In applying the I-O model to economic impact analysis, the standard procedure is to determinethe direct or first-round expenditures only. No attempt is made to pursue such inquiries onexpenditure in subsequent rounds, not even, for example, to trace the effects in the regionaleconomy on household expenditures by vineyard employees on food, clothing, entertainment,and so on, as it is impracticable to measure these effects for an individual case, here thevineyard.The I-O model is instead based on a set of assumptions about constant and uniformproportions of expenditure. If households in general in the regional economy spend, forexample, 13.3 per cent of their income on food and non-alcoholic beverages, it is assumed that6A glossary of I-O terminology is provided in Appendix 3.e c o n s e a r c hPage| 51
<strong>Kangaroo</strong> <strong>Island</strong> Futures Authority Draft Economic Impact of Agriculture and Tourismthose working in vineyards do likewise. Indeed, the effects of all expenditure rounds after thefirst are calculated by using such standard proportions (i.e. multiplier calculations). Once atransactions table has been compiled, simple mathematical procedures can be applied toderive multipliers for each sector in the economy.Input-output multipliersInput-output multipliers are an indication of the strength of the linkages between a particularsector and the rest of the state or regional economy. As well, they can be used to estimate theimpact of a change in that particular sector on the rest of the economy.Detailed explanations on calculating I-O multipliers, including the underlying assumptions, areprovided in any regional economics or I-O analysis textbook (see, for example, Jensen andWest (1986)). They are calculated through a routine set of mathematical operations based oncoefficients derived from the I-O transactions model, as outlined below.The transactions table may be represented by a series of equations thus:X = X + X + .................... + X + Y1 11 12 1n1X = X + X + .................... + X + Y2 21 22 2n2X = X + X + .................... + X + Yn n1 n2nn nwhere X i = total output of intermediate sector i (row totals);X ij = output of sector i purchased by sector j (elements of the intermediatequadrant); andY j = total final demand for the output of sector i.It is possible, by dividing the elements of the columns of the transactions table by therespective column totals to derive coefficients, which represent more clearly the purchasingpattern of each sector. These coefficients, termed 'direct' or 'I-O' coefficients, are normallydenoted as aij, and represent the direct or first round requirements from the output of eachsector following an increase in output of any sector.In equation terms the model becomes:X1= a11X 1+ a12X 2+ .................... + a1 nX n+ Y1X2 = a21X1 + a22X2+ .................... + a2nXn+ Y2X = a X + a X + .................... + a X + Yn n1 11 n2 2nn n nwhere a ij (the direct coefficient ) = X ij /X j . This may be represented in matrix terms:X = AX + Ywhere A = [a ij ], the matrix of direct coefficients.e c o n s e a r c hPage| 52
<strong>Kangaroo</strong> <strong>Island</strong> Futures Authority Draft Economic Impact of Agriculture and TourismThe previous equation can be extended to:(I-A)X = Ywhere (I-A) is termed the Leontief matrix,or X = (I-A) -1 Ywhere (I-A) -1 is termed the 'general solution', the 'Leontief inverse' or simply the inverse of theopen model.The general solution is often represented by:Z = (I-A) -1 = [z ij ]The I-O table can be 'closed' with respect to certain elements of the table. Closure involves thetransfer of items from the exogenous portions of the table (final demand and primary inputquadrants) to the endogenous section of the table (intermediate quadrant). This implies thatthe analyst considers that the transferred item is related more to the level of local activity thanto external influences. Closure of I-O tables with respect to households is common and hasbeen adopted in this project.The 'closed' direct coefficients matrix may be referred to as A * . The inverse of the Leontiefmatrix formed from A * is given by:Z * = (I- A * ) -1 = [z * ij]Z * is referred to as the 'closed inverse' matrix.A multiplier is essentially a measurement of the impact of an economic stimulus. In the case ofI-O multipliers the stimulus is normally assumed to be an increase of one dollar in sales to finaldemand by a sector. The impact in terms of output, contribution to gross regional product,household income and employment can be identified in the categories discussed below.(i)The initial impact: refers to the assumed dollar increase in sales. It is the stimulus or thecause of the impacts. It is the unity base of the output multiplier and provides the identitymatrix of the Leontief matrix. Associated directly with this dollar increase in output is anown-sector increase in household income (wages and salaries, drawings by owneroperators etc.) used in the production of that dollar. This is the household incomecoefficient h j . Household income, together with other value added (OVA), provide thetotal gross regional product from the production of that dollar of output. The grossregional product coefficient is denoted v j . Associated also will be an own-sector increasein employment, represented by the size of the employment coefficient. This employmentcoefficient e j represents an employment/output ratio and is usually calculated as'employment per million dollars of output'.(ii) The first round impact: refers to the effect of the first round of purchases by the sectorproviding the additional dollar of output. In the case of the output multiplier this is shownby the direct coefficients matrix [a ij ]. The disaggregated effects are given by individual a ijcoefficients and the total first-round effect by Σa ij . First-round household income effectsare calculated by multiplying the first-round output effects by the appropriate householdincome coefficient (h j ). Similarly, the first-round gross regional product and employmente c o n s e a r c hPage| 53
<strong>Kangaroo</strong> <strong>Island</strong> Futures Authority Draft Economic Impact of Agriculture and Tourismeffects are calculated by multiplying the first-round output effects by the appropriategross regional product (v j ) and employment (e j ) coefficients.(iii) Industrial-support impacts. This term is applied to 'second and subsequent round' effectsas successive waves of output increases occur in the economy to provide industrialsupport, as a response to the original dollar increase in sales to final demand. The termexcludes any increases caused by increased household consumption. Output effects arecalculated from the open Z inverse, as a measure of industrial response to the first-roundeffects. The industrial-support output requirements are calculated as the elements of thecolumns of the Z inverse, less the initial dollar stimulus and the first-round effects. Theindustrial support household income, gross regional product and employment effects aredefined as the output effects multiplied by the respective household income, grossregional product and employment coefficients. The first-round and industrial-supportimpacts are together termed the production-induced impacts.(iv) Consumption-induced impacts: are defined as those induced by increased householdincome associated with the original dollar stimulus in output. The consumption-inducedoutput effects are calculated in disaggregated form as the difference between thecorresponding elements in the open and closed inverse (i.e. z* ij - z ij , and in total as Σ(z* ij -z ij ). The consumption-induced household income, gross regional product and employmenteffects are simply the output effects multiplied by the respective household income, grossregional product and employment coefficients.(v) Flow-on impacts: are calculated as total impact less the initial impact. This allows for theseparation of 'cause and effect' factors in the multipliers. The cause of the impact is givenby the initial impact (the original dollar increase in sales to final demand), and the effect isrepresented by the first-round, industrial-support and consumption-induced effects,which together constitute the flow-on effects.Each of the five impacts are summarised in Appendix Table 2.1. It should be noted thathousehold income, gross regional product and employment multipliers are parallel concepts,differing only by their respective coefficients h j , v j and e j .The output multipliers are calculated on a 'per unit of initial effect' basis (i.e. output responsesto a one dollar change in output). Household income, gross regional product and employmentmultipliers, as described above, refer to changes in household income per initial change inoutput, changes to gross regional product per initial change in output and changes inemployment per initial change in output. These multipliers are conventionally converted toratios, expressing a 'per unit' measurement, and described as Type I and Type II ratios. Forexample, with respect to employment:Type I employment ratio= [initial + first round + industrial support]/initialandType II employment ratio= [initial + production induced 7 + consumption induced]/initial7Where (first round + industrial support) = production induced.e c o n s e a r c hPage| 54
<strong>Kangaroo</strong> <strong>Island</strong> Futures Authority Draft Economic Impact of Agriculture and TourismAppendix Table 2.1The structure of input-output multipliers for sector i aImpactsGeneral formulaOutput multipliers ($)Initial 1First-roundΣ i a ijIndustrial-supportΣ i z ij -1-Σ i a ijConsumption-inducedΣ i z * ij-Σ i z ijTotalΣ i z * ijFlow-onΣ i z * ij-1Household Income multipliers ($)Initialh jFirst-roundΣ i a ij h iIndustrial-supportΣ i z ij h i - h j -Σ i a ij h iConsumption-inducedΣ i z * ijh i -Σ i z ij h iTotalΣ i z * ijh iFlow-onΣ i z * ijh i -h jGross regional product multipliers ($)Initialv jFirst-roundΣ i a ij v iIndustrial-supportΣ i z ij v i - v j -Σ i a ij v iConsumption-inducedΣ i z * ijv i -Σ i z ij v iTotalΣ i z * ijv iFlow-onΣ i z * ijv i -v jEmployment multipliers (full time equivalents)Initiale jFirst-roundΣ i a ij e iIndustrial-supportΣ i z ij e i - e j -Σ i a ij e iConsumption-inducedΣ i z * ije i -Σ i z ij e iTotalΣ i z * ije iFlow-onΣ i z * ije i -e jaIn a DECON model, Z * (the ‘closed inverse’ matrix), includes a population and an unemployed row and column(see below for details).Model assumptionsThere are a number of important assumptions in the I-O model that are relevant ininterpreting the analytical results.• Industries in the model have a linear production function, which implies constantreturns to scale and fixed input proportions.• Another model assumption is that firms within a sector are homogeneous, whichimplies they produce a fixed set of products that are not produced by any other sectorand that the input structure of the firms are the same. Thus it is preferable to have asmany sectors as possible specified in the models and the standard models for thisstudy were compiled with 66 sectors (see Appendix 1 for further detail).e c o n s e a r c hPage| 55
<strong>Kangaroo</strong> <strong>Island</strong> Futures Authority Draft Economic Impact of Agriculture and Tourism• The model is a static model that does not take account of the dynamic processesinvolved in the adjustment to an external change, such as a permanent change innatural resources management.Extending the standard economic impact model as a DECON modelBased on work undertaken by EconSearch (2009 and 2010a) and consistent with Mangan andPhibbs (1989), the I-O model developed for this project was extended as demographiceconomic(DECON) model. The two key characteristics of the DECON model, when comparedwith a standard economic model, are as follows.1. The introduction of a population ‘sector’ (or row and column in the model) makes itpossible to estimate the impact on local population levels of employment growth ordecline.2. The introduction of an unemployed ‘sector’ makes it possible to account for theconsumption-induced impact of the unemployed in response to economic growth ordecline.The population ‘sector’The introduction of a population ‘sector’ to the standard I-O model allows for the calculationof population multipliers. These multipliers measure the flow-on population impact resultingfrom an initial population change attributable to employment growth or decline in a particularsector of the regional economy.Calculation of population multipliers is made possible by inclusion of a population row andcolumn in the 'closed' direct coefficients matrix of the I-O model.Population row: the population coefficient (pj) for sector j of the DECON model is representedas:p j= -rho j * e j * family size jwhererho j = the proportion of employees in sector j who remain in the region after theylose their job (negative employment impact) or the proportion of new jobs in sectorj filled by previously unemployed locals (positive employment impact);e j = the employment coefficient for sector j; andfamily size j = average family size for sector j.Population column: the population column of the DECON model is designed to account forgrowth or decline in those sectors of the economy that are primarily population-driven (i.e.influenced by the size of the population) rather than market-driven (i.e. dependent uponmonetary transactions). Clearly, many of the services provided by the public sector fit thisdescription and, for the purpose of this analysis, it was assumed that the followingintermediate sectors were primarily population-driven:• public administration and defence;e c o n s e a r c hPage| 56
<strong>Kangaroo</strong> <strong>Island</strong> Futures Authority Draft Economic Impact of Agriculture and Tourism• education;• health and community services; and• cultural and recreational services.Thus, the non-market coefficient for sector j of the DECON model is represented asexpenditure on that non-market service (by governments) in $million per head of population.The population multiplier for sector j is represented as: z * pj / p pjwhere z * pj = coefficient of the ‘closed inverse’ matrix in the population row for sector j;andp pj =coefficient of the direct coefficients matrix in the population row for sectorj.Sources of local data for the population sector of the DECON models used in this projectincluded the following.• rho: little or no published data are available to assist with estimation of this variable,particularly at a regional level. The DECON models have been constructed to enablethe analyst to estimate this variable on the basis of the availability superior data orassumptions.• Family size: in order to estimate average family size by industry, relevant data wereextracted from the Australian Bureau of Statistics 2006 Census of Population andHousing using the TableBuilder database. These data were modified by the consultantsin order to ensure consistency with the specification and conventions of the I-Omodels.The unemployed ‘sector’As outlined above, the introduction of an unemployed ‘sector’ to the standard I-O modelmakes it possible to account for the consumption-induced impact of the unemployed inresponse to economic growth or decline.Through the inclusion of an unemployed row and column in the 'closed' direct coefficientsmatrix of the standard I-O model it is possible to calculate Type III multipliers (for output, grossregional product, household income and employment).The key point to note is that, in the situation where at least some of the unemployed remain ina region after losing their job (negative employment impact) or some of the new jobs in aregion are filled by previously unemployed locals (positive employment impact), Type IIImultipliers will be smaller than the more frequently used Type II multipliers.Unemployed row: the unemployed coefficient (u j ) for sector j of the DECON model isrepresented as:u j= -rho j * (1-ess j ) * e je c o n s e a r c hPage| 57
<strong>Kangaroo</strong> <strong>Island</strong> Futures Authority Draft Economic Impact of Agriculture and Tourismwhererho j = the proportion of employees in sector j who remain in the region after theylose their job (negative employment impact) or the proportion of new jobs in sectorj filled by previously unemployed locals (positive employment impact);ess j = the proportion of employed in sector j who are not eligible for welfarebenefits when they lose their job; ande j = the employment coefficient for sector j.Unemployed column: the unemployed column of the DECON model is an approximation oftotal consumption expenditure and the consumption pattern of the unemployed. It isrepresented as dollars per unemployed person rather than $million for the region as a whole,as is the case for the household expenditure column in a standard I-O model.Sources of local (i.e. state and regional) data for the unemployed sector of the DECON modelsused in this study included the following.• ess: in order to estimate the proportion of employed by industry who are not eligiblefor welfare benefits when they lose their job, relevant data were were extracted fromthe Australian Bureau of Statistics 2006 Census of Population and Housing using theTableBuilder database. These data were modified by the consultants in order to ensureconsistency with the specification and conventions of the I-O models.• Unemployed consumption: total consumption expenditure by the unemployed wasbased on an estimate of the Newstart Allowance whilst the pattern of consumptionexpenditure was derived from household income quintiles in the 2003/04 HouseholdExpenditure Survey (ABS 2006).Incorporating a tourism demand profile in the I-O modelTourism expenditure is a measure of the value of sales of goods and services to visitors tothe state or region. The following method and data sources were used to estimate tourismexpenditure by industry sector for the region.• The primary data were sourced from Tourism Research Australia (TRA).• Base datasets included total tourism expenditure by TRA tourism region and averageexpenditure profiles, by region, across a range of goods and services (e.g. food anddrink, fuel, shopping, etc.).• Estimates were available for domestic day, domestic overnight and internationalvisitor expenditure.• The first adjustment to the base data was the development of a concordance betweenthe TRA tourism regions and I-O model regions and the allocation of these base data tothe relevant I-O model region. These allocations were based, in turn, on an ABSconcordance between TRA tourism regions and SLAs.• The second adjustment to the base data was the application of a more detailedexpenditure breakdown from the ABS Australian National Accounts: Tourism SatelliteAccount for both domestic and international visitor expenditure (ABS 2010d).e c o n s e a r c hPage| 58
<strong>Kangaroo</strong> <strong>Island</strong> Futures Authority Draft Economic Impact of Agriculture and Tourism• The third adjustment to the base data was the conversion of tourism expenditureestimates from purchasers’ to basic prices (i.e. reallocation of net taxes (taxes minussubsidies) and marketing and transport margins) to make the data consistent withaccounting conventions used in the national, state and regional I-O models.Purchasers’ to basic price ratios for tourism expenditure categories were derived fromABS data.• The final adjustment to the base data was the allocation of the tourism expendituredata in basic prices to the relevant input-output sectors (intermediate sectors, taxesless subsidies or imports) in which the expenditure occurred, thus compiling a profileof sales to final demand. This process was undertaken for each type of tourismexpenditure (domestic day, domestic overnight and international visitor) and theresults aggregated to form a single tourism demand profile. Profiles were developed atthe state and regional levels.Constructing a RISE v3.0 economic impact modelIn the final model construction stage the data described above were incorporated into aMicrosoft Excel® spreadsheet based economic impact model for the region and state (i.e. RISEv3.0) 8 . This model allows for description of the structure of the economy. It can also be usedfor the estimation of economic impacts over time in response to the introduction of a newindustry or a change in the final demand for the output of one or many sectors. Modelassumptions can be modified to account for:• price changes between the model construction year (2009/10) and the base year forthe analysis;• labour productivity change over time (as above and for the subsequent years);• the level of regional migration (e.g. for a positive employment impact, the proportionof new jobs filled by previously unemployed locals).8For further details on the use and application of this type of model see EconSearch (2010b).e c o n s e a r c hPage| 59
<strong>Kangaroo</strong> <strong>Island</strong> Futures Authority Draft Economic Impact of Agriculture and TourismAPPENDIX 3 GLOSSARY OF INPUT-OUTPUT TERMINOLOGYContents ........................................................................................................................................ iiTables ............................................................................................................................................ivFigures ...........................................................................................................................................ivAbbreviations ................................................................................................................................ vDocument History and Status ....................................................................................................... vExecutive Summary .......................................................................................................................vi1. Introduction ........................................................................................................................ 12. Method ............................................................................................................................... 32.1 Method of Analysis ................................................................................................... 32.2 I-O Model Construction ............................................................................................ 32.3 Indicators of Economic Impact ................................................................................. 63. Review and Consultation .................................................................................................... 83.1 Aim of the Consultation Process .............................................................................. 83.2 Review of Policy, Planning and Program Documents ............................................... 83.3 Growth Limiters ........................................................................................................ 94. Profile of Economic Activity on <strong>Kangaroo</strong> <strong>Island</strong> .............................................................. 124.1 <strong>Kangaroo</strong> <strong>Island</strong> Economy in 2011/12 .................................................................... 124.2 <strong>Kangaroo</strong> <strong>Island</strong> Economy: Recent Trends ............................................................. 145. Economic Contribution of Tourism ................................................................................... 165.1 Visitor Numbers and Tourism Expenditure ............................................................ 165.2 Economic Contribution of Tourism ......................................................................... 176. Economic Contribution of Agriculture .............................................................................. 196.1 Area and Value of Production................................................................................. 196.2 Economic Contribution of Agriculture .................................................................... 217. Pathways to Growth ......................................................................................................... 257.1 Tourism ................................................................................................................... 257.1.1 <strong>Kingscote</strong> <strong>Airport</strong> upgrade ........................................................................... 257.1.2 Drivers of tourism growth ............................................................................ 307.1.3 Economic contribution of tourism - low growth scenario ........................... 337.1.4 Economic contribution of tourism - moderate scenario .............................. 347.1.5 Economic contribution of tourism – high growth scenario .......................... 367.1.6 Summary ...................................................................................................... 377.2 Agriculture .............................................................................................................. 377.2.1 Drivers of agricultural industry growth ........................................................ 37e c o n s e a r c hPage| 60
<strong>Kangaroo</strong> <strong>Island</strong> Futures Authority Draft Economic Impact of Agriculture and Tourism7.2.2 Economic contribution of agriculture – low growth scenario ...................... 387.2.3 Economic contribution of agriculture – moderate growth scenario ............ 397.2.4 Economic contribution of agriculture – high growth scenario ..................... 407.2.5 Summary ...................................................................................................... 41References ................................................................................................................................... 43Appendix 1 Intermediate Sector Specification ....................................................................... 45Appendix 2 An Overview of Economic Impact Analysis using the Input-Output Method ..... 50Appendix 3 Glossary of Input-Output Terminology ............................................................... 60Appendix 4 List of Policy and Planning Documents ............................................................... 62Appendix 5 Tourism Markets and their Potential for Growth ............................................... 64Appendix 6 Summary of Key Growth Opportunities Raised during Consultation ................. 68Appendix 7 Stakeholders Consulted ...................................................................................... 73Appendix 8 Notes for Consultation ....................................................................................... 741. Introduction ...................................................................................................................... 76Aim 76Previous studies, plans and research ................................................................................ 762. Key Growth Limiters.......................................................................................................... 78Growth Limiters - General ................................................................................................ 78Growth Limiters – Tourism Focus ..................................................................................... 79Growth Limiters – Agriculture Focus ................................................................................ 793. Tourism Scenarios ............................................................................................................. 80Base case ........................................................................................................................... 80Moderate growth .............................................................................................................. 81Other scenarios ................................................................................................................. 814. Agriculture Scenarios ........................................................................................................ 82Base case ........................................................................................................................... 82Moderate growth .............................................................................................................. 82Other scenarios ................................................................................................................. 825. Thought Starters ............................................................................................................... 83Appendix 9 Expenditure on Transport Services on <strong>Kangaroo</strong> <strong>Island</strong> .................................... 84Type III multiplier is a modified Type II multiplier, calculated by including a population andunemployed row and column in the 'closed' direct coefficients matrix of the standard I-Omodel. Calculated as (direct effects + production-induced effects + consumption-inducedeffects + offsetting consumption effects)/direct effects.e c o n s e a r c hPage| 61
<strong>Kangaroo</strong> <strong>Island</strong> Futures Authority Draft Economic Impact of Agriculture and TourismAPPENDIX 4 LIST OF POLICY ANDPLANNING DOCUMENTSThe following is a list of policy, planning and program documents that have been considered inorder to determine whether the scenarios that have been developed for use in the economicimpact modelling have a reasonable chance of being delivered based on levels of support (i.e.understanding, leadership, commitment, resourcing, etc.) from policy makers and the<strong>Kangaroo</strong> <strong>Island</strong> tourism and agriculture industries particularly. The list is not meant to becomplete but rather a cross section of examples.The documents were also used to construct a list of growth inhibitors used in the discussionpaper entitled Impact of Agriculture and Tourism Industries on the <strong>Kangaroo</strong> <strong>Island</strong> Economy:Notes for Consultation (Appendix 8) that was used as a basis for consultation with a targetedlist of stakeholders (Appendix 7).The documents are divided into three sections:1. Local and regional policy, planning and programs2. State government policy, planning and programs3. Commonwealth government policy, planning and programsLocal and regional policy, planning and programs1. <strong>Kangaroo</strong> <strong>Island</strong> Plan: A volume of the South Australian Planning Strategy 20112. <strong>Kangaroo</strong> <strong>Island</strong> Plan- reference to Priorities for <strong>Kangaroo</strong> <strong>Island</strong> identified in the StrategicInfrastructure Plan for South Australia, Regional Overview, 2005-06–2014-15 Land(economic development)3. <strong>Kangaroo</strong> <strong>Island</strong> Council (KIC) Strategic Plan 2010 – 2014 with particular reference to‘Common Ground’ Study4. <strong>Kangaroo</strong> <strong>Island</strong> Development Plan 20 December 20115. <strong>Kangaroo</strong> <strong>Island</strong> Strategic Tourism Plan, Urban & Regional Planning Solutions for Tourism<strong>Kangaroo</strong> <strong>Island</strong> 2006 including Checklist for Planning: A tool for proponents of tourismdevelopment6. Destination Action Plan 2012-2014 <strong>Kangaroo</strong> <strong>Island</strong>7. Local Government on <strong>Kangaroo</strong> <strong>Island</strong> Today and Tomorrow JAC Comrie Pty Ltd 13 March20088. <strong>Kangaroo</strong> <strong>Island</strong> Council Camping and Day Visitor Strategy for <strong>Kangaroo</strong> <strong>Island</strong> CouncilSepte3mber 2007 Shannon Architects9. The Strategic Plan for Regional South Australia – <strong>Kangaroo</strong> <strong>Island</strong>10. Understanding Visitor Wildlife Interactions: <strong>Kangaroo</strong> <strong>Island</strong> Rebecca Saltzer ResearchOfficer Tourism Program James Cook University Douglas Queensland 2002 - Part of aNational Wildlife Based Tourism Project coordinated by the CRC for sustainable tourism.11. <strong>Kangaroo</strong> <strong>Island</strong> Sport, Recreation and Open Space Strategy October 2005 Suter &Associates Leisure & Tourism Planners12. Economic Analysis of Road Funding Options on <strong>Kangaroo</strong> <strong>Island</strong> Econsearch July 2010e c o n s e a r c hPage| 62
<strong>Kangaroo</strong> <strong>Island</strong> Futures Authority Draft Economic Impact of Agriculture and Tourism13. <strong>Kangaroo</strong> <strong>Island</strong> Regional Transport Study April 2007State government policy, planning and programs14. South Australia’s Strategic Plan (SASP)15. South Australian Tourism Plan 2009–201416. SATC 2012 / 2013 Strategy Briefing17. Let Yourself Go (phase two) SATC current18. South Australia-China Partnership: A Shared Future Directions Paper, April 2012 (AustraliaChina <strong>Business</strong> Council and Government of SA)19. The South Australian Tourism Commission (SATC) China Strategy20. SATC Industry Forum Market Update Presentation of China and Hong Kong November201221. Chinese Market Profile SATC (undated – circa 2011-2012)Commonwealth government policy, planning and programs22. Tourism 2020 Tourism Australia23. China Approved Destination Status (ADS) Scheme Tourism Australia24. Bass Strait Passenger Vehicle Equalisation Scheme Monitoring Report No 13 (May 2012)Bureau of Infrastructure, Transport and Regional Economics (BITRE)e c o n s e a r c hPage| 63
<strong>Kangaroo</strong> <strong>Island</strong> Futures Authority Draft Economic Impact of Agriculture and TourismAPPENDIX 5 TOURISM MARKETSAND THEIR POTENTIAL FORGROWTHThe following summary of points raised by stakeholders during consultations highlights the linkbetween sectors of the tourism market, the utilisation of spare capacity in realising short termgrowth potential and the milestone barriers to growth for the middle and longer terms.DisclaimerThis section provides a summary of discussions with stakeholders during consultations. Theviews expressed are the views of the stakeholders consulted unless shown otherwise. Noattempt has been made to validate the information provided. The information should not berelied upon for any purpose other than that stated as the purpose of this report.Domestic intrastate extended stay marketIt was stated during consultations that a significant proportion of South Australians had notbeen to <strong>Kangaroo</strong> <strong>Island</strong> despite a strong recognition and expressed desire. Strong recognitionand desire were seen as opportunities to grow this market segment.As a (part) explanation for the lower than expected conversion rate, it was suggested that theSouth Australian (intrastate) domestic market was more price sensitive than interstate andinternational markets. Some suggested that there was a perceived high cost of transport to the<strong>Island</strong> particularly for visitors originating in South Australia. Most stakeholders identifiedaddressing the cost, availability and quality of access options by sea and air as a priority for anyfuture growth in tourism on <strong>Kangaroo</strong> <strong>Island</strong>.It was suggested that there was considerable capacity in the current <strong>Kangaroo</strong> <strong>Island</strong> tourismindustry to absorb significant growth in the short term without the need for majorinfrastructure spending if the growth occurred outside of peak times. It was felt that there wassufficient accommodation for example, particularly in the 3 – 4 star range, for short termgrowth in the domestic extended stay market with more accommodation to be added asmarket demand grew.Stakeholders also felt that there was sufficient capacity in broader community infrastructurelike power and water supply to support an increased visitation in this market segmentprovided it was off peak. They suggested that these systems currently coped with peakdemand during the six or so weeks over Christmas and the Easter period and that there maybe capacity for tourism growth provided that the increase did not occur at these times. Theideal outcome was described as ‘push up and flatten out’ the distribution curve of visitationacross the year leaving the peak times at their near capacity.Note that while stakeholders believed that capacity for electricity supply was available in offpeak times particularly, they were concerned about the reliability of this service and pointedout the need to upgrade the undersea cable and to address the issue of the high reliance ondiesel back up.e c o n s e a r c hPage| 64
<strong>Kangaroo</strong> <strong>Island</strong> Futures Authority Draft Economic Impact of Agriculture and TourismThe marketing challenge of getting the message out that the winter months on <strong>Kangaroo</strong><strong>Island</strong> were ‘wild, wet and woolly’ (and that this was a good thing!) was identified. It wassuggested that the nature experience was better in the shoulder seasons when the wildlifewas more active and that this could be strengthened as a marketing message.Domestic interstate extended stay marketDiscussions with stakeholders reinforced the importance of the domestic interstate extendedstay market segment, the success of recent destination marketing programs and the growth todate in domestic interstate visitation.The success of the road trip to <strong>Kangaroo</strong> <strong>Island</strong> along the Great Ocean Road was provided asan example. The broader benefits of this program were described including leverageopportunities for other regions in the form of ‘along the way’ programs.The continuing use of <strong>Kangaroo</strong> <strong>Island</strong> as a draw card to anchor a longer stay in the state wasraised as further reason for the South Australian Tourism Commission and other public andprivate sector partners to promote <strong>Kangaroo</strong> <strong>Island</strong> and leverage off this effort. There was ageneral feeling that growth in the domestic interstate market could continue at trend orbetter.International marketGrowth in the international market segment was seen as a clear opportunity by stakeholders.It was generally understood that some of the constraints were out of the control of localjurisdictions such as externalities like the strength of the $A.It was pointed out that increasing the proportion of international visitors to domestic visitorscould be expected to lift the return to the <strong>Kangaroo</strong> <strong>Island</strong> economy based on the TourismOptimisation Management Model (TOMM 2011/12) data that indicated that internationalvisitors spent more during their stay than interstate visitors and intrastate visitors.The China market was seen as a new / emerging target market with potential for growth. Itwas important for some we spoke with that this approach was consistent with the State’sbroader China market development strategy. Advantages were pointed out like the potentialto ‘piggy back’ off other relationships being built with China in other sectors such as mining,service industries and education.Facilitating infrastructure to develop the international markets that were raised includedexpanding the point of origin options for air access to <strong>Kangaroo</strong> <strong>Island</strong> to include places likeMelbourne and Perth. This suggestion would require an upgrade to the <strong>Kingscote</strong> airportwhich was seen as a milestone development for growth beyond the short term.Direct air access to <strong>Kangaroo</strong> <strong>Island</strong> from Melbourne in particular was raised as a potentialmiddle to longer term growth facilitator for the international market with potential to open a‘sub-market’ for interstate extended stay visitation. The ‘sub-market’ status related to thedistinction between road travel (eg Great Ocean Road trip) and those who may fly in and fly /cruise out.<strong>Kangaroo</strong> <strong>Island</strong> as a sole destination for visitors was further differentiated from the potentialfor <strong>Kangaroo</strong> <strong>Island</strong> to be part of a wider itinerary. Examples included the pairing of <strong>Kangaroo</strong><strong>Island</strong> with the Barossa as a wine / wildlife experience for international visitors with thise c o n s e a r c hPage| 65
<strong>Kangaroo</strong> <strong>Island</strong> Futures Authority Draft Economic Impact of Agriculture and Tourismopportunity identified through visitor preference research conducted by the South AustralianTourism Commission.The need for additional accommodation of 4 plus star quality was raised to cater for growth inthe international market. Stakeholders reinforced that general accommodation stocks(including private rental accommodation, Bed and Breakfast, live aboard boats, motel / hotelstyle accommodation and lodge style for example) were sufficient to cope with short termgrowth in the domestic market with the possible exception of this higher star rated segment.The importance of a presence in international markets and the capacity to developrelationships along tourism industry supply chains was clearly expressed by severalstakeholders. It was noted that private sector and SATC presence was growing in internationalmarkets such as China. The emergence of on line promotion and booking services was seen asa way that individual tourism operators may penetrate international markets althoughpreference for traditional booking arrangements (travel agents) was noted in current Chinamarkets.The scope of possible growth targets for international visitation appeared more closely linkedto significant infrastructure development than was the case for short – middle term domesticmarket growth. Given the significance of this issue, a case study for airport upgrade as amilestone development has been developed separately.One important consideration noted in research of international visitation by the SouthAustralian Tourism Commission was that visitors from the China market preferred to travel inthe December – February period. Whilst the current public infrastructure, utilities supply,accommodation and the capacity at major attractions like Seal Beach could cope with currentloads, it was generally seen to be at or near capacity at these peak times.Further growth at peak times would accelerate the need for major infrastructure developmentin each of these categories. A measuring stick for this was seen by stakeholders to be thevulnerability of current energy supplies with a lack of redundancy in the undersea electricitycable and a heavy reliance on diesel generators to provide back up.Day trippersThere was a divided view about the scope to grow the day tripper market to <strong>Kangaroo</strong> <strong>Island</strong>.It was recognised that while day trippers may include visitors from South Australia, they mayalso include tourists from interstate or overseas who were basing their visitation in Adelaide.There was a feeling expressed that ‘one day’ trips to KI could be counterproductive if theexperience was not satisfying for visitors. The counter view was also put that a satisfying oneday experience could ‘whet the appetite’ for return visitation.A measure of the success of ‘one day’ visitation appeared to be visitor satisfaction levels thatmay influence return visitation and the potential for personal referral including modern andimportant promotion vehicles such as social media. Both of these measures could bemonitored.It was reported that there had been a steady increase in demand for day trips to <strong>Kangaroo</strong><strong>Island</strong> over recent years. However it was clear from discussions with stakeholders that dayvisitor itineraries are subject to logistical limiters. The itinerary needed to include marshallingtime, travel to / from the <strong>Island</strong> and travel around the <strong>Island</strong> as a fixed component. Theselimitations on access appear to be a natural growth inhibitor linked to the capacity of thesee c o n s e a r c hPage| 66
<strong>Kangaroo</strong> <strong>Island</strong> Futures Authority Draft Economic Impact of Agriculture and Tourismservices. For example, the day tripper market needed to travel to the <strong>Island</strong> in a small windowof time in the morning and return in a small window in the afternoon / evening.This implies that to grow the day tripper market above organic growth rates would requirefresh ‘investment’ rather than taking up existing spare capacity. This was one of thedifferentiating features between the potential for growth in one day visitation and othermarkets.Increasing the length of stay of visitorsStakeholders suggested that there was an opportunity to increase the length stay of visitors,particularly for international visitors.Discussion around how long it takes to ‘do the <strong>Island</strong>’ was noted from stakeholders referencingthe TOMM data and satisfaction levels for visitors. It was felt that the capacity to extend visitscould be enhanced by investment in new tourism experiences (increase the offering).The significance of events was raised as an important anchor for visitation. Opportunities toexpand the <strong>Island</strong>’s event program were suggested by linking to major state events such asTour Down Under and the Festival of Arts. Such leveraging was seen as a way to reduce risk asthe market was clearly defined and could be targeted. There were some infrastructureimplications raised such as access to bike tracks and venues and these may impact on timingfor specific growth opportunities.Returning more of visitor expenditure to the regional economyA greater focus on promoting local products was identified by stakeholders as a first step tokeeping more of the visitor expenditure in the local economy. An example was noted in theYorke Peninsula Tourism Plan where a target existed to raise the proportion of visitorexpenditure returned to the Gross Regional Product from 46% to 50% in 4 years. A similarstrategy was suggested for <strong>Kangaroo</strong> <strong>Island</strong>.Developing an inventory of local products and services was seen by stakeholders as areasonable place to start and it was noted that a separate study on this aspect is currentlyunderway for <strong>Kangaroo</strong> <strong>Island</strong> led by the <strong>Kangaroo</strong> <strong>Island</strong> Futures Authority. One example of amanagement tool to track exposure of local products in the market was raised. It was theannual audit of ‘local product displayed’ that was conducted until recently by Tourism<strong>Kangaroo</strong> <strong>Island</strong>.e c o n s e a r c hPage| 67
<strong>Kangaroo</strong> <strong>Island</strong> Futures Authority Draft Economic Impact of Agriculture and TourismAPPENDIX 6 SUMMARY OF KEYGROWTH OPPORTUNITIES RAISEDDURING CONSULTATIONThe following tables provide a summary of some of the key growth opportunities raised bystakeholders during consultations. The list is not seen as complete or exclusive but rather anillustration of the potential as seen by individual stakeholders and some implications foractions and timelines.GENERAL ECONOMYGrowthopportunityOn linecapabilityPossible actions required Potential partners Significantinfrastructure orother investment(yes / no)Continue to developcapability and capacity in ecommerce across theeconomy on <strong>Kangaroo</strong><strong>Island</strong>Industry bodiesRDANoTimeframeShort 1- 4 yearsMedium 5 – 9Long 10 plusShortWater fordomestic andcommercial useDevelop WaterManagement Plans.Balance use for residentialand visitor use, agricultureand other industrial usesand environmentalpurposes. Baseenvironmental flowcalculations on pre clearingrun off environmentKI NRM No Short – mediumEnergyinfrastructureContinue to promote theupgrade of the underseaelectrical cableKICRDAstate governmentindustry bodieselectricity industryYesMedium to longDevelop opportunities forgrowth in the renewableenergy industry on<strong>Kangaroo</strong> <strong>Island</strong> consistentwith Brand <strong>Kangaroo</strong> <strong>Island</strong>KICRDAstate governmentindustry bodieselectricity industryYesMedium – longStructuraladjustmentRecognise and plan for theunique structuraladjustment implications on<strong>Kangaroo</strong> <strong>Island</strong> inindustries like commercialfishingstate governmentKIFARDANo / possiblyShort – mediumPolicydevelopmentConsider policydevelopment in the contextof the unique communitystructure of <strong>Kangaroo</strong>KICstate governmentcommonwealthgovernmentNoShorte c o n s e a r c hPage| 68
<strong>Kangaroo</strong> <strong>Island</strong> Futures Authority Draft Economic Impact of Agriculture and TourismGrowthopportunityPossible actions required Potential partners Significantinfrastructure orother investment(yes / no)<strong>Island</strong> and its morepronounced response tostructural adjustmentTimeframeShort 1- 4 yearsMedium 5 – 9Long 10 plusSupportagenciesSupport representativebodies that candemonstrate goodpenetration into therelevant <strong>Kangaroo</strong> <strong>Island</strong>industry communitiesstate governmentindustry bodiesNoShort<strong>Kangaroo</strong> <strong>Island</strong>Council andgovernanceRespond to the role of theKIC and its unique financialand other circumstances toenhance good governancepractices already in placeKICstate governmentcommonwealthgovernmentNoShort – mediumTOURISM INDUSTRYGrowthopportunityDomesticintrastatevisitorsPossible actions required Potential partners Significantinfrastructureinvestment(yes / no)Marketing of shoulder andlow seasonSATCTKIIndividual tourismoperatorsNoTimeframeShort 1- 4 yearsMedium 5 – 9 yearsLong 10 plus yearsShort – mediumDomesticinterstatevisitorsMarketing of products likecoastal drive and ‘on theway’ programsSATCTKIIndividual tourismoperatorsNoShort – mediumInternationalvisitors<strong>Airport</strong> upgradeDirect air services fromMelbourne and PerthKICstate governmentcommonwealthgovernmentYesMedium – long4 plus star accommodationprivate investorsYesMedium – longIncreased presence ininternational markets of KItourism productstravel agentsNoShort – mediumLength of stayfor visitorsMarketing extended stayrelated to eventsSATCtravel agentsindividual tourismoperatorsNoMedium – longTarget international visitorsto stay one more daySATCtravel agentsindividual tourismoperatorsNoMedium – longReturn more toGRP from visitorInventory of local productsPromotion of localKIFATKINoShorte c o n s e a r c hPage| 69
<strong>Kangaroo</strong> <strong>Island</strong> Futures Authority Draft Economic Impact of Agriculture and TourismGrowthopportunityexpenditurePossible actions required Potential partners Significantinfrastructureinvestment(yes / no)productsTimeframeShort 1- 4 yearsMedium 5 – 9 yearsLong 10 plus yearsRegular review of localproducts exposureTKI No ShortBranddevelopmentLink Brand development toNational LandscapeprogramIndustry bodiesIndividual tourismoperatorsNoShort – medium<strong>Kangaroo</strong> <strong>Island</strong>unique stories‘Water gap’Promote ‘hero experiences’as unique <strong>Kangaroo</strong> <strong>Island</strong>storiesDevelop benchmarking forimpact of water gap interms of net benefit / cost.Include social inclusion aswell as other commercialcost factors.SATCTKIIndividual tourismoperatorsKIFAIndustry bodiesNoNoShort – mediumShortConsider subsidies andother measures for certaintransport uses ie residentialpassengers, visitorpassengers, visitor vehicles,commercial freight etcKIFAstate governmentTKIYes / governmentbudgetimplicationsShortConsider market solutionsto allow for cost savings tocarriers (which may bepassed on) such assmoothing the traveldemand across the year.transport carriersTKIindividual tourismoperatorsNoShort - mediumInvest in significantinfrastructure developmentto encourage competitionin the transport marketplaceKIFAstate governmentcommonwealthgovernmenttransport carriersprivate investorsYesLongTourismaccommodationPromote four plus staraccommodationdevelopment in line withgrowth in Internationaltourism visitor growthPrivate investorsYesMedium – longIdentify and prepareinventory of allaccommodation includingmarket sensitive privateholiday homesPrivate sectorIndustry bodiesNoShortSmooth visitortraffic across theyearMarket <strong>Kangaroo</strong> <strong>Island</strong> inshoulder and low seasonSATCTKIIndividual tourismoperatorsNoShort – mediume c o n s e a r c hPage| 70
<strong>Kangaroo</strong> <strong>Island</strong> Futures Authority Draft Economic Impact of Agriculture and TourismGrowthopportunityPossible actions required Potential partners Significantinfrastructureinvestment(yes / no)Work with sea and airtransport to generatebusiness models thatpositively impact on pricingSATCTKIIndividual tourismoperatorsNoTimeframeShort 1- 4 yearsMedium 5 – 9 yearsLong 10 plus yearsShort – mediumAGRICULTURE INDUSTRYGrowthopportunityWool and primelambsPossible actions required Potential partners Significantinfrastructure orother investment(yes / no)Use a combination oftechnology (egconsideration of genetics inbreeding programs) andmanagement practices toimprove productivity andproduct qualityIndividual farmersIndustry groupsNo / possiblyTimeframeShort 1- 4 yearsMedium 5 – 9Long 10 plusMediumDevelop industry initiativessuch as marketing / Branddevelopment and grouppurchasingIndustry groupsand cooperativesof businessesSATCPIRSANoShort - mediumSheep dairyFind ways to increasesupply of inputs such assheep’s milk to help meetdemand. Investigatetechnology solutions forstorage (longevity) ofsheep’s milkIndividual farmers No Short - mediumConsolidation ofland holdingsRecognise an interest inmaintaining land ataffordable prices. Improveaccess to capital forinvestorsIndividual farmersIndustry groupsPIRSAYesShort – mediumSmalllandholdingintensivefarmingPromote appropriate landuse planning and link thisto resource managementthrough Water andEnvironmentalManagement Plans forexampleKICKI NRMNoMediumLow volume,high valueproductsIdentify low volume, highvalue adding opportunitiesin innovation programs for<strong>Kangaroo</strong> <strong>Island</strong>businesses (does notpreclude any industrysectors)Industry groups Yes / possibly Medium – longMarket Develop cooperative Individual farmers No Short – mediume c o n s e a r c hPage| 71
<strong>Kangaroo</strong> <strong>Island</strong> Futures Authority Draft Economic Impact of Agriculture and TourismGrowthopportunityapproaches tomanagingfreight costsPossible actions required Potential partners Significantinfrastructure orother investment(yes / no)practices to approach Industry groupstransport carriers acrossthe supply chain (egtransport companies,access providers in sea andair, storage / warehousingdistribution, retailing)TimeframeShort 1- 4 yearsMedium 5 – 9Long 10 plusInterventionalapproaches tomanagingfreight costsExpand sea and airportfacilities / infrastructure topromote competition in thetransport marketState GovernmentKICprivate investorsYesLongConsider subsidies andother measures for certaintransport uses ieresidential passengers,visitor passengers, visitorvehicles, commercialfreight etcState governmentCommonwealthgovernmentYes/governmentbudgetimplicationsShort – mediumBlue gumsIdentify the potentialfutures for blue gumplantations on <strong>Kangaroo</strong><strong>Island</strong>Individual farmers/ corporate entitiesKICstate governmentNoShortBranddevelopmentDevelop Brand consortiaand agree Brandmanagement protocolsIndustry bodiesNoShort – mediumPromote a wider exposureof Brand <strong>Kangaroo</strong> <strong>Island</strong> inmainland marketsIndustry bodiesNoShort – mediumAlign other activities on<strong>Kangaroo</strong> <strong>Island</strong> with Brand(community buy in)whole ofcommunityNoShort – mediumValue addingand exportinfrastructureInvest in major facilities toadd value on island (e.g.processing facilities) andexport infrastructure suchas bulk handling facilitiesThese are complexcommercial matters andhave not been factoredinto assumptions for thepurpose of this economicimpact modelling.Private sector Yes at need – driven bycommercialbusiness caseThe scale ofpotential projectsallows for them tobe separatelyoverlaid in the RISEmodelling as theopportunities arisee c o n s e a r c hPage| 72
<strong>Kangaroo</strong> <strong>Island</strong> Futures Authority Draft Economic Impact of Agriculture and TourismAPPENDIX 7 STAKEHOLDERSCONSULTEDThe following stakeholders were consulted during November 2012 and January 2013:1. Gerard Snowball , RDA Adelaide Hills Fleurieu and <strong>Kangaroo</strong> <strong>Island</strong>2. Justin Harman, GM <strong>Island</strong> Pure and KI Food and Wine3. Megan Harvie, KI Food and Wine4. Richard Tretheway, Presiding Member KI NRM5. Andrew Heinrich, Agriculture KI6. Greg Johnson , <strong>Kangaroo</strong> <strong>Island</strong> Wool Group7. Craig Wickham, Chair of the National Landscapes Steering Group, Board member of KIFA8. Pierre Gregor, Chair of Tourism <strong>Kangaroo</strong> <strong>Island</strong>9. <strong>Kangaroo</strong> <strong>Island</strong> Council , elected members, executive and staff10. Ian Drummond, Executive Chairman Aurora Resorts & Hotels Pty Ltd11. Gideon Baker, Director of Sales and Marketing Aurora Resorts & Hotels Pty Ltd12. Donna Gauci, General Manager Sealink13. Adam Stanford , SATC14. Sandi Watkins , State Manager SA Vic and Tasmania, REX Airlines15. State government agencies with an interest in agriculture and forestry (e.g. DENR, PIRSA)e c o n s e a r c hPage| 73
<strong>Kangaroo</strong> <strong>Island</strong> Futures Authority Draft Economic Impact of Agriculture and TourismAPPENDIX 8 NOTES FORCONSULTATIONImpact of Agriculture andTourism Industries on the<strong>Kangaroo</strong> <strong>Island</strong> Economy:Notes for ConsultationA study undertaken for<strong>Kangaroo</strong> <strong>Island</strong> Futures AuthorityPrepared by11 November 2012EconSearch Pty Ltd214 Kensington RoadMarryatville SA 5068Tel: (08) 8431 5533Fax: (08) 8431 7710www.econsearch.com.aue c o n s e a r c hPage| 74
<strong>Kangaroo</strong> <strong>Island</strong> Futures Authority Draft Economic Impact of Agriculture and TourismContentsIntroduction ...................................................................................................................... 76AimPrevious studies, plans and research ................................................................................ 76Key Growth Limiters .................................................................................................................... 78Growth Limiters - General ................................................................................................ 78Growth Limiters – Tourism Focus ..................................................................................... 79Growth Limiters – Agriculture Focus ................................................................................ 79Tourism Scenarios ....................................................................................................................... 80Base case ........................................................................................................................... 80Moderate growth .............................................................................................................. 81Other scenarios ................................................................................................................. 81Agriculture Scenarios .................................................................................................................. 82Base case ........................................................................................................................... 82Moderate growth .............................................................................................................. 82Other scenarios ................................................................................................................. 82Thought Starters.......................................................................................................................... 83e c o n s e a r c hPage| 75
<strong>Kangaroo</strong> <strong>Island</strong> Futures Authority Draft Economic Impact of Agriculture and Tourism1. INTRODUCTIONAimThe aim of the consultation is to reach agreement with key stakeholders on what might bereasonable tourism and agriculture growth scenarios to include in the economic impact study.Previous studies, plans and researchIn the absence of a current <strong>Kangaroo</strong> <strong>Island</strong> Integrated Strategic Tourism Plan (DestinationAction Plan 2012 – 2014 acknowledged) and Agricultural Plan that sets targets and describedstrategies to promote growth in the time frame to 2020 and 2040 this paper seeks to identifycritical factors or growth limiters by considering a select number of studies, plans and researchfrom a variety of sources.The <strong>Kangaroo</strong> <strong>Island</strong> Plan: A volume of the South Australian Planning Strategy 9 (The Plan)provides a guide to future land use and development on the <strong>Island</strong> for the period 2010 to2036. The <strong>Kangaroo</strong> <strong>Island</strong> Plan is one of seven regional volumes that, together with the 30-Year Plan for Greater Adelaide, make up the South Australian Planning Strategy. However, itdoes not set specific growth targets, particularly for agriculture on the <strong>Island</strong>.The following studies, plans and research have been considered. Note: It is recognised thatsome of this work is aged and various actions have been taken in response to the studies.1. South Australia’s Strategic Plan (SASP) as included in the September 2012 Progress Reportprepared by the SASP Audit Committee2. Mention of priorities for <strong>Kangaroo</strong> <strong>Island</strong> identified in the Strategic Infrastructure Plan forSouth Australia, Regional Overview, 2005/06 – 2014/15 (economic development) in<strong>Kangaroo</strong> <strong>Island</strong> Plan (KI Plan) – a volume of the SA Planning Strategy 20113. <strong>Kangaroo</strong> <strong>Island</strong> Council Strategic Plan 2010 - 20144. <strong>Kangaroo</strong> <strong>Island</strong> Development Plan 20 December 20115. Local Government on <strong>Kangaroo</strong> <strong>Island</strong> Today and Tomorrow, JAC Comrie Pty Ltd, 13 March20086. Bureau of Infrastructure, Transport and Regional Economics: Bass Strait Passenger VehicleEqualisation Scheme Monitoring Report No 13, May 20127. Research provided by SATC8. <strong>Kangaroo</strong> <strong>Island</strong> Strategic Tourism Plan, Urban & Regional Planning Solutions for TourismKI 2006 and the Checklist for Planning: A tool for proponents of tourism development -excerpt from the KI Strategic Tourism Plan 2006 - 20119Department of Planning and Local Government 2011.e c o n s e a r c hPage| 76
<strong>Kangaroo</strong> <strong>Island</strong> Futures Authority Draft Economic Impact of Agriculture and Tourism9. KI Council Camping and Day Visitor Strategy for KI Council, Shannon Architects, September200710. Mention of Strategic Plan for Regional South Australia – <strong>Kangaroo</strong> <strong>Island</strong> Section in KICouncil Camping and Day Visitor Strategy for KI Council, Shannon Architects, September200711. Understanding Visitor Wildlife Interactions : <strong>Kangaroo</strong> <strong>Island</strong>, Rebecca Saltzer ResearchOfficer Tourism Program James Cook University Douglas Queensland, 200212. KI Sport, Recreation and Open Space Strategy, Suter & Associates Leisure & TourismPlanners, October 200513. Economic Analysis of Road Funding Options on <strong>Kangaroo</strong> <strong>Island</strong>, Econsearch July 201014. KI Regional Transport Study April 200715. <strong>Kangaroo</strong> <strong>Island</strong> Watergap Recognition Project, prepared for <strong>Kangaroo</strong> <strong>Island</strong> DevelopmentBoard (EconSearch in association with Meyrick & Associates, 2009)16. Economic Contribution of Tourism and Agriculture to the <strong>Kangaroo</strong> <strong>Island</strong> RegionalEconomy, EconSearch prepared for the <strong>Kangaroo</strong> <strong>Island</strong> Development Board (2009)17. <strong>Kangaroo</strong> <strong>Island</strong> Reduction in Transport Costs Study, EconSearch prepared for the<strong>Kangaroo</strong> <strong>Island</strong> Development Board (2007)18. Economic Contribution of <strong>Kangaroo</strong> <strong>Island</strong> to the State Economy, EconSearch prepared forthe <strong>Kangaroo</strong> <strong>Island</strong> Development Board (2005)19. <strong>Kangaroo</strong> <strong>Island</strong> Council Infrastructure Study, EconSearch prepared for <strong>Kangaroo</strong> <strong>Island</strong>Council (2003)20. Destination Marketing Plan for <strong>Kangaroo</strong> <strong>Island</strong> SATC / TKI 2012 – 2014e c o n s e a r c hPage| 77
<strong>Kangaroo</strong> <strong>Island</strong> Futures Authority Draft Economic Impact of Agriculture and Tourism2. KEY GROWTH LIMITERSThe following growth limiters have been identified from the various studies, plans andresearch:Growth Limiters - General11. The availability of a consistent and agreed data and information set that can be applied inthe development of business cases, strategies and plans such as the SA Strategic Plan andKI Tourism Plan12. The cost, nature (e.g. style, point of origin) and availability (e.g. scheduling) of access to<strong>Kangaroo</strong> <strong>Island</strong> for residents, visitors and freight13. The quality and availability of ‘gateway’ infrastructure providing access to <strong>Kangaroo</strong> <strong>Island</strong>or from <strong>Kangaroo</strong> <strong>Island</strong> to other destinations. Examples include:e. <strong>Kingscote</strong> airportf. Penneshaw and Cape Jervis seaportsg. <strong>Kingscote</strong> porth. other potential seaports, bulk handling facilities and processing plants such as BallastHead and American River14. The maintenance and augmentation of sealed and unsealed roads, trails and other internaltransport systems15. The supply of essential services infrastructure including water, waste, electricity andhousing16. The availability of business and community services infrastructure including health andeducation facilities for general purpose servicing of residents and visitors17. The development and application of environmental policy that places constraints oneconomic development in order to conserve and enhance natural assets18. The development and application of wildlife protection and resource management policysuch as Marine Parks19. The costs of development and returns on investment for comparable development on KIand alternative sites on the mainland20. Constraints related to emergency plans such as action plans for natural risks like bushfireand other extreme eventse c o n s e a r c hPage| 78
<strong>Kangaroo</strong> <strong>Island</strong> Futures Authority Draft Economic Impact of Agriculture and TourismGrowth Limiters – Tourism Focus7. The quality and availability of ‘gateway’ infrastructure providing access to <strong>Kangaroo</strong> <strong>Island</strong>or from <strong>Kangaroo</strong> <strong>Island</strong> to other destinations. Examples include:c. marinas such as Christmas Cove and <strong>Kingscote</strong>d. boat ramps and other service points with mixed use such as emergency services,recreational fishing and commercial fishing safe havens.8. The upgrade and addition of tourism infrastructure such as ‘hero experiences’ andaccommodation with a focus on the high end market and encouraging visitors to staylonger9. Support for industry development appropriate for tourism linkage such as agriculture,viticulture, wine making, art, culture, recreation and sport to encourage food and winetourism, art and culture tourism and recreation / adventure tourism10. The role of land use planning such as appropriate zoning for tourism development likeaccommodation, farm stay and microenterprise development11. The development and maintenance of public and private facilities including camping andcaravanning parks, rest stations, ablutions and liquid waste sumps for boat andrecreational vehicle use12. Natural limits for visitor flows to key attractions based on environmental, wildlifeprotection or logistical (e.g. safe road carrying capacity) factorsGrowth Limiters – Agriculture Focus6. Allocation of water resources7. Threat of pest and disease incursions on clean green image (as well as cost and yieldeffects)8. Fragmentation and loss of productive agricultural land to other land uses9. Development Plan regulations that prevent or make difficult change in land use10. Lack of incentives and opportunities to develop value adding clusters and medium to largevalue adding opportunitiese c o n s e a r c hPage| 79
<strong>Kangaroo</strong> <strong>Island</strong> Futures Authority Draft Economic Impact of Agriculture and Tourism3. TOURISM SCENARIOSSouth Australia Strategic Plan (SASP) Targets: source: http://saplan.org.au/targets/4-tourismindustryThe SASP is the overall frame of reference for industry and community development in SouthAustralia. Target four (4) of the SASP is to ‘increase visitor expenditure in South Australia’stotal tourism industry to $8 billion and on <strong>Kangaroo</strong> <strong>Island</strong> to $180 million by 2020.The SASP audit 2012 found that the total tourism expenditure in South Australia increasedfrom $3.77 billion in 2002 (the baseline year) to $4.73 billion in 2011. The average annualgrowth rate from 2002 to 2011 was 2.55%. To achieve the 2020 target of $8 billion will requirean average annual growth rate of 6.01%.The SASP Audit Committee found that data on tourism expenditure on <strong>Kangaroo</strong> <strong>Island</strong> wasnot reliably available and they were consequently unable to rate progress against the target toincreasing visitor expenditure on the <strong>Island</strong> to $180 million by 2020.The following three draft scenarios are provided as examples:1. Base case scenario2. Moderate growth scenario3. High or other growth scenarioThe scenarios will feature a base of 2001/02, trend analysis from 2006/7 and key targets datesof 2019/20 and 2039/40Base caseThe base case will map the trend of tourism growth in visitor numbers and visitor expenditurefrom 2006/07 to 2011/12. The trend will be extrapolated to 2019/20 and beyond to 2039/40.The economic impact modelling will focus on the value to the economy (Gross RegionalProduct (GRP)), employment and population. The potential industry profile for the 2019/20 KIeconomy will be presented to provide insight into community health and education needs astwo key social indicators.TOMM data related to visitor numbers will be substituted for the visitor numbers in the coredata above.It will be assumed in the base case:1. That the ratio of domestic day, domestic overnight and international visitors will beconsistent with the 2011/12 distribution and maintained as a constant through the period.2. That the relationship between industry sectors in the economy will remain the same asthat of 2011/12; that is there will be no significant structural change in the relationshipsbetween industry sectors such as retail, health and education. It is acknowledged thatstructural change becomes more likely over time with the impact of major change agentse c o n s e a r c hPage| 80
<strong>Kangaroo</strong> <strong>Island</strong> Futures Authority Draft Economic Impact of Agriculture and Tourismlike improved technology (e.g. broadband), demographic changes such as an ageingpopulation and policy influences like responses to climate change.Moderate growthThe moderate growth scenario will reflect the target of $180 million of visitor expenditure for<strong>Kangaroo</strong> <strong>Island</strong> by 2019/20 established in the South Australian Strategic Plan. As with thebase case, TOMM data related to visitor numbers will be substituted for the visitor numbers inthe core data above.As with the base case, it will be assumed in the moderate growth scenario:1. That the ratio of domestic day, domestic overnight and international visitors will beconsistent with the 2011/12 distribution and maintained as a constant through the period.2. That the relationship between industry sectors in the economy will remain the same asthat of 2011/12; that is there will be no significant structural change in the relationshipsbetween industry sectors such as retail, health and education.An annual growth rate in the order of 4.9% will be required to achieve this target.Other scenarios1. High growth scenario: A growth target that reflects a doubling of visitor number by 2020could be included.2. Changing assumptions within the base case and moderate growth scenario: The basecase and moderate growth scenario assume no change to the ratio of visitor type and therelationship between industries in the economy over time. Scenarios could be developedthat show the impact of changing these or other variables. Two variables that could betested are:a. the impact of changing the ratio of domestic day, domestic overnight and internationalvisitors to include more domestic overnight and / or international visitorsb. the impact of say 25%, 50% or 100% of domestic overnight and international visitorsstaying one more night3. Shift share: The shift share model is a way of demonstrating the performance of thetourism industry on <strong>Kangaroo</strong> <strong>Island</strong> compared with the performance of the industryacross the state. This approach helps to identify how each of the industry sectors withintourism such as accommodation or transport, are performing compared with theircounterparts elsewhere. Such an approach helps to identify which areas of the industry areperforming well and can be used to focus attention on comparative advantage.e c o n s e a r c hPage| 81
<strong>Kangaroo</strong> <strong>Island</strong> Futures Authority Draft Economic Impact of Agriculture and Tourism4. AGRICULTURE SCENARIOSThree draft scenarios (base case, moderate growth and high or other growth) are provided asexamples as a basis for discussion.Base caseThe base case will map the trend of growth in the value of agricultural production from 2001to 2006 and to 2011. The trend will be extrapolated to 2016 and beyond to 2021.In nominal terms the total value of agriculture decreased by approximately 23% between 2001($45.6m) and 2006 ($35.0m) but almost doubled between 2006 and 2011 ($67.4m). It shouldbe noted that the value of agricultural production in 2006 was particularly low due to thedrought. Over the 10 year period, 2001 to 2011, the total value of agriculture increased by 48per cent. In real terms, over the same period, the total value of agriculture increased by 10 percent.It will be assumed in the base case:1. No change in the land use profile2. No change in the level of farm gate value addingModerate growthTo realise the vision for KI, The Plan outlines a principle to “maintain and strengthen primaryproduction in appropriate areas”. However, it does not set a target for growth in agriculture onthe <strong>Island</strong>. KIFA are focused on how to deliver on a target of doubling 2010 farm gate incomeson KI by 2020.Between 2001 and 2011 the nominal value of agricultural production increased by 48 per cent.A moderate growth target would be to increase farm gate incomes by 50% by 2020 (from the2011 level). That is, half of what would be required under the KIFA target.Other scenarios1. High growth scenario: A growth target that reflects a doubling of farm gate incomes by2020 could be included as identified by KIFA (also acknowledging the EDB discussion paper‘Paradise Girt by Sea’ (2010)).2. Changing assumptions within the base case and moderate growth scenario: The basecase and moderate growth scenario assume no change to the landuse profile or level offarm gate value adding. Two variables that could be tested are:a. Changing the land use profileb. An increase in the level of farm gate value addinge c o n s e a r c hPage| 82
<strong>Kangaroo</strong> <strong>Island</strong> Futures Authority Draft Economic Impact of Agriculture and Tourism5. THOUGHT STARTERSQuestions for consideration:1. Are there other key studies, plans and research that should be considered as backgroundto building reasonable, realistic and authentic scenarios for economic impact modelling?2. Is the list of growth limiters a fair representation of those important considerations indeveloping reasonable, realistic and authentic scenarios?3. What other growth limiters should be taken into account when considering reasonabletargets for growth in tourism and agriculture on <strong>Kangaroo</strong> <strong>Island</strong>?4. What are the priority interventions, investments and policy reforms that may addressgrowth limiters? What if any initiatives are in place or likely, what is the scale ofinvestment that they represent and what timelines do they have?5. How are growth limiters linked together? For example, what is the natural order of stepsto be taken to deliver growth?6. Are the base case and moderate growth scenarios for growth in tourism and agriculture on<strong>Kangaroo</strong> <strong>Island</strong> a reasonable starting point?7. What ‘other scenarios’ would best represent reasonable, realistic and authentic growthtargets growth in tourism and agriculture on <strong>Kangaroo</strong> <strong>Island</strong>?8. Are there other reliable data sets that you can identify and recommend for their accuracyand reliability? How can / will these data sets be sustained over time?These are ‘thought starters’ only. A range of views from various stakeholders is encouraged.e c o n s e a r c hPage| 83
<strong>Kangaroo</strong> <strong>Island</strong> Futures Authority Draft Economic Impact of Agriculture and TourismAPPENDIX 9 EXPENDITURE ONTRANSPORT SERVICES ONKANGAROO ISLANDClearly the cost of doing business on <strong>Kangaroo</strong> <strong>Island</strong> is directly affected by the cost oftransport. A number of key transport-related issues that directly impact the cost of doingbusiness on the <strong>Island</strong> have been identified in previous studies.• Freight cost - transport between KI and mainland markets (Adelaide) is considered tobe relatively expensive as a result of the land distance, the sea crossing costs and therelatively low population/economic base on KI.• Under-utilisation of capacity - average utilisation of available capacity is generally lowat approximately 30 per cent for passengers, 40 per cent for freight and 50 per cent forvehicles, however, during peak times there is little or no spare capacity.• Transport inefficiencies - because a higher volume of freight is exported from theisland than is imported, a lack of back loads lead to transport inefficiencies thattranslate into higher transport costs. Further transport inefficiencies result from downtime associated with ferry travel (i.e. marshalling, loading, travel time), short travellingdistances, over-capitalisation and aging equipment.• Lack of competition - over the years, several proposals have been submitted to theSouth Australian Government from parties wishing to operate competing ferry servicesbetween the mainland and KI. Independent modelling has indicated that theintroduction of a direct competitor to SeaLink on the Cape Jervis to Penneshaw routecould result in commercial failure of one of the services.In previous studies (EconSearch 2003 and 2007, in particular), freight costs for primaryproducers on <strong>Kangaroo</strong> <strong>Island</strong> were analysed and compared with those for producers on themainland. The analysis showed, for example, a load of grain from <strong>Kangaroo</strong> <strong>Island</strong> to Adelaidewould cost almost 2.8 times that of a mainland grain producers trucking grain 200 km toAdelaide. The cost for the KI producer is almost 1.4 times that of a mainland grain producertrucking grain 400 km to Adelaide.Similar differentials apply to freight costs for superphosphate and livestock, although these arenot as great for wool when compared to the shorter mainland route (i.e. 200 km).While the analysis indicates the clear freight cost disadvantage of primary producers on<strong>Kangaroo</strong> <strong>Island</strong>, this does not give a cross-economy view of the island’s cost of doing business.One way to examine the broader picture is to calculate the expenditure on transport servicesof all industries on the island as a proportion of total intermediate expenditures by local firmsand then to compare this ratio for <strong>Kangaroo</strong> <strong>Island</strong> with similar ratios for South Australia andAustralia.e c o n s e a r c hPage| 84
<strong>Kangaroo</strong> <strong>Island</strong> Futures Authority Draft Economic Impact of Agriculture and TourismThese estimates are reported in Table 1. Note that data are preliminary estimates for 2011/12in the case of South Australia and <strong>Kangaroo</strong> <strong>Island</strong> and 2008/09 for Australia.Table 1: Expenditure on transport services as a percentage of total intermediate expenditure<strong>Kangaroo</strong><strong>Island</strong>(2011/12)SouthAustralia(2011/12)Australia(2008/09)Intermediate expenditure on transport services ($m) 22 2,601 39,113Total intermediate expenditure ($m) 117 68,733 1,255,894Transport expenditure as a proportion of total 18.4% 3.8% 3.1%Source: <strong>Kangaroo</strong> <strong>Island</strong> and South Australian data are drawn from preliminary RISE models for2011/12 prepared by EconSearch as part of a study undertaken for the <strong>Kangaroo</strong> <strong>Island</strong> FuturesAuthority. Australian data are drawn from ABS (2012e).Despite the different years, the transport expenditure data show the stark difference between<strong>Kangaroo</strong> <strong>Island</strong> and comparable estimates at the state and national levels. On <strong>Kangaroo</strong><strong>Island</strong>, transport expenditure as a percentage of total intermediate expenditure is estimated tobe 18.4 per cent compared with 3.8 per cent for South Australia and 3.1 per cent for Australiaas a whole.Based on these figures, it would suggest that around 15 per cent more (on average across allindustries) is spent on transport services on <strong>Kangaroo</strong> <strong>Island</strong> compared to South Australia andAustralia. The difference could be partly explained by the difference in industry mix on<strong>Kangaroo</strong> <strong>Island</strong> to that found in the state and national economies. If the industries on<strong>Kangaroo</strong> <strong>Island</strong> are more reliant on freight services than those in the rest of the state/country,i.e. if the economy has a higher proportion of primary industries (which are high users oftransport services) and a lower proportion of service industries (which are relatively low usersof transport services) then the proportion of transport expenditure as a proportion of totalexpenditure would be expected to be above average. While it is true that primary industriesare “over-represented” when compared to the state and national economies, the other mainindustries on the island are the service sectors that support the island’s tourism industry.When considering the cost of doing business differential between <strong>Kangaroo</strong> <strong>Island</strong> andelsewhere, it is not just transport costs that are relevant. For example, when sourcing servicesthat are not available on the <strong>Island</strong>, there can be additional costs involved. On abuilding/construction project if contractors from the mainland are required, not only will thecost of materials be greater than on the mainland (due to the freight differential), but therewill be additional travel time (labour costs) and possibly accommodation costs that would notbe incurred on an equivalent mainland project. Consequently, while the task of quantifying thecost of doing business on <strong>Kangaroo</strong> <strong>Island</strong> would be a complex analysis and quite beyond thescope of this study, based on the transport expenditure data discussed above the additionalcosts of doing business on <strong>Kangaroo</strong> <strong>Island</strong> are likely to be significantly above those forbusinesses in communities a similar distance from the State’s capital.e c o n s e a r c hPage| 85
<strong>Kangaroo</strong> <strong>Island</strong> <strong>Airport</strong> Upgrade <strong>Business</strong> <strong>Case</strong> - <strong>Appendices</strong>DAppendix - Development PlansAurora Ozone Hotel – Proposed 45 room hotel / apartment complex, <strong>Kingscote</strong>.May 2013