- Page 1: IN SITU MEASUREMENTS OF BUILDING MA
- Page 4 and 5: University of Plymc, - ý-i E. 3 LS
- Page 6 and 7: CONTENTS Abstract .................
- Page 8 and 9: Introduction to the in situ measure
- Page 10 and 11: List of charts Chart 1: Thermal dif
- Page 12 and 13: Chart 54: Voltra temperature rises
- Page 14 and 15: Figure 26: Thermal image of clay st
- Page 16 and 17: Equation (28) .....................
- Page 18 and 19: Author's declaration At no time dur
- Page 21 and 22: Chapter 1: Introduction This thesis
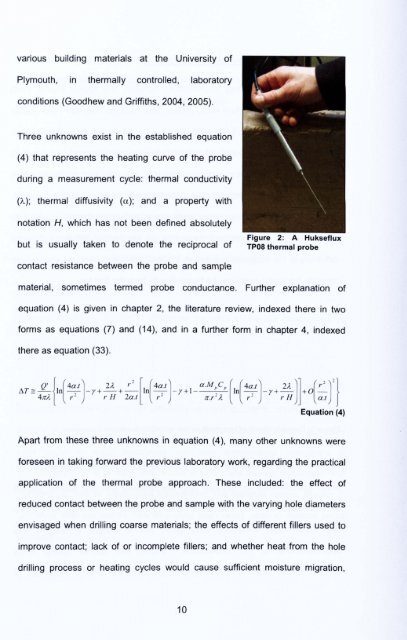
- Page 23 and 24: shown the potential, in the UK clim
- Page 25 and 26: and practical obstacles to the succ
- Page 27 and 28: through the solid. Convection, as a
- Page 29: Introduction to the thermal probe t
- Page 33 and 34: za U) > uj ý r- C >, ()) = ui SD 0
- Page 35 and 36: Global C02 emissions from fossil fu
- Page 37 and 38: they can contribute not only to rev
- Page 39 and 40: e Empirical knowledge and experienc
- Page 41 and 42: Guide thermal property values are o
- Page 43 and 44: hot plate measurements of construct
- Page 45 and 46: With a supposed accuracy of better
- Page 47 and 48: Chapter 2: Literature review, the t
- Page 49 and 50: Figure 6: Niven (1905), hot wire ap
- Page 51 and 52: thermal resistance inherent to each
- Page 53 and 54: temperature rises more slowly after
- Page 55 and 56: plate method for thermal conductivi
- Page 57 and 58: ecause there was a temperature diff
- Page 59 and 60: temperature rise at very early time
- Page 61 and 62: such as the probe wall thickness, c
- Page 63 and 64: could have identical thermal diffus
- Page 65 and 66: A small cylinder of acrylic materia
- Page 67 and 68: negative values were thought to be
- Page 69 and 70: whether the outcome was dependent o
- Page 71 and 72: measured at various depths through
- Page 73 and 74: for thermal diffusivity was achieve
- Page 75 and 76: Tests were first carried out on foa
- Page 77 and 78: achieved, believing that small comp
- Page 79 and 80: the whole temperature rise over the
- Page 81 and 82:
(1949) to measure liquids, to more
- Page 83 and 84:
and instead two wires of different
- Page 85 and 86:
was described as equivalent to a gr
- Page 87 and 88:
thermocouple was attached to the ho
- Page 89 and 90:
this could have explained discrepan
- Page 91 and 92:
Equation (14) was reduced to: IM AT
- Page 93 and 94:
L ct. t 1/2 r 0.0632r 2 Equation (2
- Page 95 and 96:
The boundary condition raises furth
- Page 97 and 98:
the probe. Hence thermal conductivi
- Page 99 and 100:
the difference in results for paraf
- Page 101 and 102:
a= Cr I/4 exp(B / A) Equation (24)
- Page 103 and 104:
put forward that the measurement ra
- Page 105 and 106:
where the early times, identified f
- Page 107 and 108:
Results achieved with the thermal p
- Page 109 and 110:
without consideration of contact re
- Page 111 and 112:
Van Haneghem et al (1998) had more
- Page 113 and 114:
at the University of Bristol; and o
- Page 115 and 116:
cited were quite different form the
- Page 117 and 118:
a= 4(exp y)x, and 42: 1 respectivel
- Page 119 and 120:
diffusivity value and the length of
- Page 121 and 122:
symptoms in AT/Int were not given;
- Page 123 and 124:
published values well. Thermal diff
- Page 125 and 126:
from assuming an infinitely long li
- Page 127 and 128:
assessed after what time the heat c
- Page 129 and 130:
Goodhew and Griffiths (2005) report
- Page 131 and 132:
25mm x 0.6mm stainless steel needle
- Page 133 and 134:
The problem of contact resistance w
- Page 135 and 136:
oth a stand-alone probe with a heat
- Page 137 and 138:
thermal diffusivity results could b
- Page 139 and 140:
Contemporary standards relating to
- Page 141 and 142:
directions are given to accommodate
- Page 143 and 144:
measurements requires prior technic
- Page 145 and 146:
Discussion arising from the literat
- Page 147 and 148:
In measurement analyses derived fro
- Page 149 and 150:
Many researchers, because of the di
- Page 151 and 152:
Chapter 3: Introduction to the meth
- Page 153 and 154:
differentiate between the temperatu
- Page 155 and 156:
* An assessment of measurements usi
- Page 157 and 158:
measurements using various case stu
- Page 159 and 160:
(1951). The sensitivity of the equa
- Page 161 and 162:
The Blackwell equation including la
- Page 163 and 164:
A further study was carded out to a
- Page 165 and 166:
measurement was introduced to the d
- Page 167 and 168:
The data sheet contained a facility
- Page 169 and 170:
is similar to the work of van Loon
- Page 171 and 172:
m U) CY) (1 - Z: (0 CD LO ll C" W)
- Page 173 and 174:
AT over In(t) , 6T/In(t) *6T/In(t-1
- Page 175 and 176:
eyond. These results related to a v
- Page 177 and 178:
Interim conclusion to the assessmen
- Page 179 and 180:
Chapter 5: Laboratoty work A number
- Page 181 and 182:
could then be revisited for further
- Page 183 and 184:
process was instigated whereby ther
- Page 185 and 186:
acetyl resin containing around 25%
- Page 187 and 188:
A Calculated over 10s Periods 0.2 0
- Page 189 and 190:
The dual probe gave a volumetric he
- Page 191 and 192:
It was found that 1.5mm high speed
- Page 193 and 194:
0.3 100s A Comparison, 3mrn Hole dr
- Page 195 and 196:
practicably possible, using a 1.5mm
- Page 197 and 198:
Temperature Stabilisation 17.00 16.
- Page 199 and 200:
Temperature Stabilisation 17.80 17.
- Page 201 and 202:
Steinhagen (1977), in a literature
- Page 203 and 204:
Assael et al (2002) considered that
- Page 205 and 206:
Power Level Assessment, Phenolic Fo
- Page 207 and 208:
A Calculated over 100s Periods - Lo
- Page 209 and 210:
Figure 13 shows 100s time window, t
- Page 211 and 212:
Probe Temperature v Elapsed Heating
- Page 213 and 214:
Vos (1955), and later researchers s
- Page 215 and 216:
Boundary Assessment, Phenolic Foam
- Page 217 and 218:
Figure 14: Thermal imaging arrangem
- Page 219 and 220:
Figure 16: 3D thermal image of a pr
- Page 221 and 222:
of measurements, and eleven others
- Page 223 and 224:
ather than insulating, aerated conc
- Page 225 and 226:
Conclusions from the laboratory bas
- Page 227 and 228:
Chapter 6: In situ measurements Int
- Page 229 and 230:
fluctuating during a measurement, a
- Page 231 and 232:
about 6 hours but could also be run
- Page 233 and 234:
Probe temperature measurement The t
- Page 235 and 236:
This methodology produced a compoun
- Page 237 and 238:
Chart 38: TP08 reactions of PT1000
- Page 239 and 240:
Example of smoothed TPOS data -PT10
- Page 241 and 242:
Figure 20: Field apparatus packed f
- Page 243 and 244:
Figure 21: The Body and probe posit
- Page 245 and 246:
A Calculated over 100s Periods 2 1.
- Page 247 and 248:
Base, needle and ambient temperatur
- Page 249 and 250:
unplastered walls, in a sheltered s
- Page 251 and 252:
locks, respectively. Samples were m
- Page 253 and 254:
ased measurements of an oven dried
- Page 255 and 256:
Figure 23: Unfired earth and woodsh
- Page 257 and 258:
Some difficulties with the techniqu
- Page 259 and 260:
Chart 51 shows average thermal cond
- Page 261 and 262:
----... - -ci.. .. Figure 25: Clay
- Page 263 and 264:
to varied thermal conductivity valu
- Page 265 and 266:
In Situ Results Over 100s Periods H
- Page 267 and 268:
a notionally dry room for six days.
- Page 269 and 270:
Chapter 7: Further work, discussion
- Page 271 and 272:
thermal diffusivity of IIAE-07 rn 2
- Page 273 and 274:
entrance losses, as proposed with t
- Page 275 and 276:
work where it is envisaged that sma
- Page 277 and 278:
Discussion The aim of this project
- Page 279 and 280:
temperature rise effects of thermal
- Page 281 and 282:
produced temperature rises in the r
- Page 283 and 284:
egion of 0.8m long. However, with t
- Page 285 and 286:
along with the effects of temperatu
- Page 287 and 288:
designers wishing to reduce energy
- Page 289 and 290:
Appendix A: Computer simulation The
- Page 291 and 292:
The author is further indebted to D
- Page 293 and 294:
Voltra thermal conductivity outcome
- Page 295 and 296:
ased on real experimental data for
- Page 297 and 298:
A Calculated over 100s Periods 0.1
- Page 299 and 300:
4) Despite the three issues above,
- Page 301 and 302:
I Relf Date Material Probe Heat Lab
- Page 303 and 304:
Rof Date Material Probe Heat Lab Ra
- Page 305 and 306:
Ket Uate material vroDS meat LaD Ke
- Page 307 and 308:
KOf uate mi rrooe meat LaD In situ
- Page 309 and 310:
I Ref Date Material Probe Heat Lab
- Page 311 and 312:
Date Material Probe Heat Lab Raw Da
- Page 313 and 314:
list Date material Probe meat Iao t
- Page 315 and 316:
Ref Date Material Probe Heat Lab Ra
- Page 317 and 318:
Location Analyses hemp situ 00("),
- Page 319 and 320:
13: 51 (f) MED/1 32 (hole B) 14: 01
- Page 321 and 322:
Output Input thermal SD Mean PC SID
- Page 323 and 324:
Input thermal properties, from Pars
- Page 325 and 326:
ASTIVI Committee D20 (2005) Standar
- Page 327 and 328:
heat flow meter methods - Dry and m
- Page 329 and 330:
Department of Trade and Industry (2
- Page 331 and 332:
Hacker J, Holmes M, Belcher S, Davi
- Page 333 and 334:
Jaeger JC (1958) The measurement of
- Page 335 and 336:
Morton T, Stevenson F, Taylor B, Sm
- Page 337 and 338:
http: //www. building. co. uk/story
- Page 339 and 340:
Todd S (2006) A review of the propo
- Page 341 and 342:
Woodside W, Messmer JH (1961a) Ther
- Page 343 and 344:
Carwile LCK, Hoge HJ (1966) Thermal
- Page 345 and 346:
Lovins AB (1996) Negawatts: Twelve
- Page 347:
Woodside W (1958) Calculation of th