Lab 9 - Center for Functional MRI
Lab 9 - Center for Functional MRI
Lab 9 - Center for Functional MRI

You also want an ePaper? Increase the reach of your titles
YUMPU automatically turns print PDFs into web optimized ePapers that Google loves.
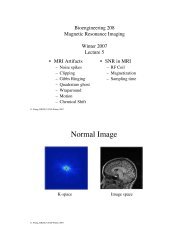
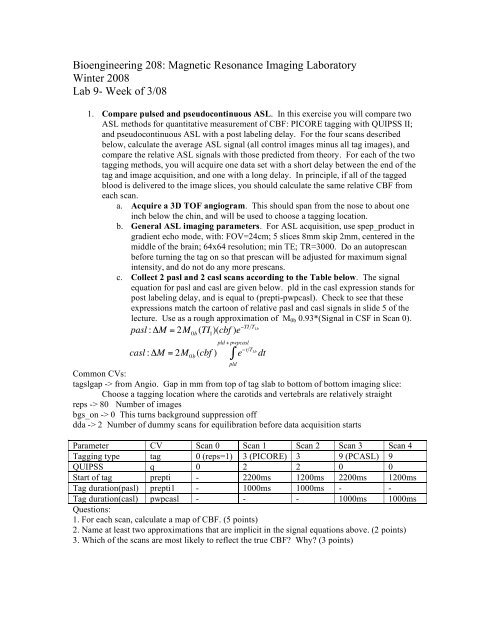
Bioengineering 208: Magnetic Resonance Imaging <strong>Lab</strong>oratory<br />
Winter 2008<br />
<strong>Lab</strong> 9- Week of 3/08<br />
1. Compare pulsed and pseudocontinuous ASL. In this exercise you will compare two<br />
ASL methods <strong>for</strong> quantitative measurement of CBF: PICORE tagging with QUIPSS II;<br />
and pseudocontinuous ASL with a post labeling delay. For the four scans described<br />
below, calculate the average ASL signal (all control images minus all tag images), and<br />
compare the relative ASL signals with those predicted from theory. For each of the two<br />
tagging methods, you will acquire one data set with a short delay between the end of the<br />
tag and image acquisition, and one with a long delay. In principle, if all of the tagged<br />
blood is delivered to the image slices, you should calculate the same relative CBF from<br />
each scan.<br />
a. Acquire a 3D TOF angiogram. This should span from the nose to about one<br />
inch below the chin, and will be used to choose a tagging location.<br />
b. General ASL imaging parameters. For ASL acquisition, use spep_product in<br />
gradient echo mode, with: FOV=24cm; 5 slices 8mm skip 2mm, centered in the<br />
middle of the brain; 64x64 resolution; min TE; TR=3000. Do an autoprescan<br />
be<strong>for</strong>e turning the tag on so that prescan will be adjusted <strong>for</strong> maximum signal<br />
intensity, and do not do any more prescans.<br />
c. Collect 2 pasl and 2 casl scans according to the Table below. The signal<br />
equation <strong>for</strong> pasl and casl are given below. pld in the casl expression stands <strong>for</strong><br />
post labeling delay, and is equal to (prepti-pwpcasl). Check to see that these<br />
expressions match the cartoon of relative pasl and casl signals in slide 5 of the<br />
lecture. Use as a rough approximation of M 0b 0.93*(Signal in CSF in Scan 0).<br />
pasl : "M = 2M 0b<br />
(TI 1<br />
)(cbf )e #TI T 1b<br />
casl : "M = 2M 0b<br />
(cbf )<br />
pld + pwpcasl<br />
$<br />
pld<br />
e #t T 1b dt<br />
Common CVs:<br />
tagslgap -> from Angio. Gap in mm from top of tag slab to bottom of bottom imaging slice:<br />
Choose a tagging location where the carotids and vertebrals are relatively straight<br />
reps !-> 80 Number of images<br />
bgs_on -> 0 This turns background suppression off<br />
dda -> 2 Number of dummy scans <strong>for</strong> equilibration be<strong>for</strong>e data acquisition starts<br />
Parameter CV Scan 0 Scan 1 Scan 2 Scan 3 Scan 4<br />
Tagging type tag 0 (reps=1) 3 (PICORE) 3 9 (PCASL) 9<br />
QUIPSS q 0 2 2 0 0<br />
Start of tag prepti - 2200ms 1200ms 2200ms 1200ms<br />
Tag duration(pasl) prepti1 - 1000ms 1000ms - -<br />
Tag duration(casl) pwpcasl - - - 1000ms 1000ms<br />
Questions:<br />
1. For each scan, calculate a map of CBF. (5 points)<br />
2. Name at least two approximations that are implicit in the signal equations above. (2 points)<br />
3. Which of the scans are most likely to reflect the true CBF Why (3 points)
2. Combined ASL and BOLD f<strong>MRI</strong>. In this exercise, you will collect dual echo ASL data<br />
during the per<strong>for</strong>mance of a functional task. Using the parameters from Scans 3 and 4<br />
above, collect 2 functional scans with task timing 30s off - 4x(30s on, 30s off). Finger<br />
tapping will work well. For both scans, set the following 2 CVs:<br />
- opnecho->2 to prescribe a dual echo acquisition. This collects one minimum TE<br />
scan, followed immediately by a second scan at longer TE.<br />
- opte2->30ms – this sets the second echo time to 30ms<br />
When you reconstruct this data, you will end up with 4 time series: one <strong>for</strong> each echo of<br />
each scan. To get a quick look at the data, you can look at it in afni to see the BOLD<br />
signal. Which echo should you be looking at Recollect data if you don’t see a clear<br />
activation. For each of the 4 image time series, go through the following processing<br />
steps:<br />
a. Within afni, run the plugin a3/d3 to generate separate ASL and BOLD time series.<br />
This plugin subtracts from each image the average of the previous and the next image,<br />
creating a new time series of signal differences (the ASL signal), and it also adds to each<br />
image the average of the previous and the next image, creating a new time series with<br />
the ASL alternation removed (this can be used as a BOLD timecourse). You now have<br />
8 time series (4 ASL and 4 BOLD).<br />
b. From the short TE ASL data set (whichever TI looks better), look <strong>for</strong> functional<br />
activation and generate a mask <strong>for</strong> the activated ROI. Use the same mask <strong>for</strong> all data<br />
sets.<br />
c. From each of your 8 timecourses, calculate the absolute and fractional signal increase<br />
with activation within the ROI. (3 points)<br />
Questions (1 point each):<br />
1. Which ASL data set gives the largest absolute activation Why<br />
2. Which ASL data set give the largest fractional activation Why<br />
3. Which ASL data set is most likely to reflect the true fractional CBF increase Why<br />
4. Should the first or second echo be used <strong>for</strong> the ASL measurement Why<br />
5. Which BOLD data set gives the largest absolute activation Why<br />
6. Which BOLD data set gives the largest fractional activation Why<br />
7. Should the first or second echo be used <strong>for</strong> the BOLD measurement Why