Strengthening Schools by Strengthening Families
Strengthening Schools by Strengthening Families
Strengthening Schools by Strengthening Families

You also want an ePaper? Increase the reach of your titles
YUMPU automatically turns print PDFs into web optimized ePapers that Google loves.
2<br />
Even so, in many neighborhoods, the challenges of child and family poverty are immense, and<br />
problems in school overlap directly with problems at home.<br />
Consider as one example the relationship with child welfare: Each year, roughly seven of every 100 children<br />
in New York City come into direct contact with the child welfare system, either through child protective<br />
investigations, preventive family support services or foster care placements. 1 This rate of involvement more<br />
than doubles in the city’s low-income communities, which generate the vast majority of child protective<br />
investigations and foster care placements. The majority of these children are school-age boys and girls.<br />
The large majority of these children also come from those city neighborhoods where they are most<br />
likely to live in poverty.<br />
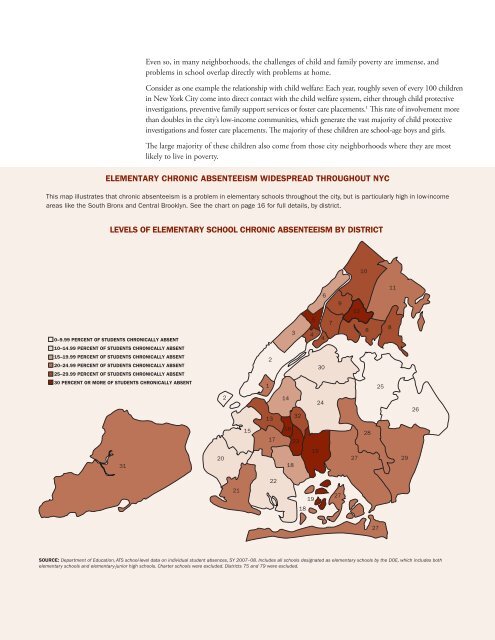
ELEMENTARY CHRONIC ABSENTEEISM WIDESPREAD THROUGHOUT NYC<br />
This map illustrates that chronic absenteeism is a problem in elementary schools throughout the city, but is particularly high in low-income<br />
areas like the South Bronx and Central Brooklyn. See the chart on page 16 for full details, <strong>by</strong> district.<br />
LEVELS OF ELEMENTARY SCHOOL CHRONIC ABSENTEEISM BY DISTRICT<br />
0–9.99 PERCENT OF STUDENTS CHRONICALLY ABSENT<br />
10–14.99 PERCENT OF STUDENTS CHRONICALLY ABSENT<br />
15–19.99 PERCENT OF STUDENTS CHRONICALLY ABSENT<br />
20–24.99 PERCENT OF STUDENTS CHRONICALLY ABSENT<br />
25–29.99 PERCENT OF STUDENTS CHRONICALLY ABSENT<br />
30 PERCENT OR MORE OF STUDENTS CHRONICALLY ABSENT<br />
31<br />
20<br />
2<br />
21<br />
SOURCE: Department of Education, ATS school-level data on individual student absences, SY 2007–08. Includes all schools designated as elementary schools <strong>by</strong> the DOE, which includes both<br />
elementary schools and elementary-junior high schools. Charter schools were excluded. Districts 75 and 79 were excluded.<br />
15<br />
1<br />
2<br />
13<br />
17<br />
22<br />
14<br />
16<br />
3<br />
18<br />
32<br />
23<br />
4<br />
5<br />
19<br />
19<br />
18<br />
30<br />
24<br />
6<br />
4<br />
7<br />
9<br />
27<br />
12<br />
27<br />
10<br />
8<br />
28<br />
27<br />
25<br />
11<br />
8<br />
29<br />
26