Thesis_gd_final_vers.. - Vernimmen
Thesis_gd_final_vers.. - Vernimmen
Thesis_gd_final_vers.. - Vernimmen

You also want an ePaper? Increase the reach of your titles
YUMPU automatically turns print PDFs into web optimized ePapers that Google loves.
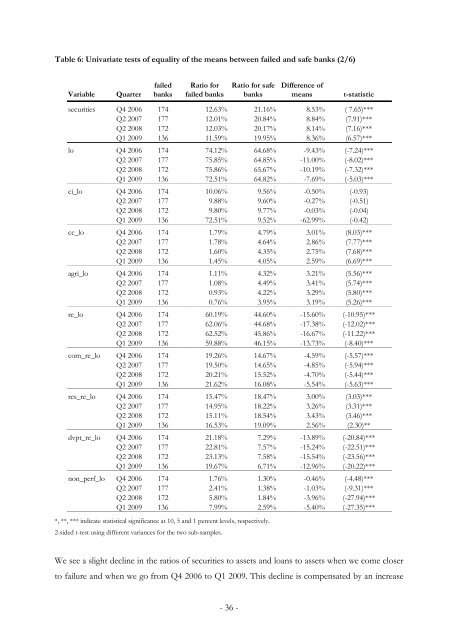
Table 6: Univariate tests of equality of the means between failed and safe banks (2/6)<br />
Variable<br />
Quarter<br />
failed<br />
banks<br />
Ratio for<br />
failed banks<br />
Ratio for safe<br />
banks<br />
Difference of<br />
means<br />
t-statistic<br />
securities Q4 2006 174 12.63% 21.16% 8.53% ( 7.65)***<br />
Q2 2007 177 12.01% 20.84% 8.84% (7.91)***<br />
Q2 2008 172 12.03% 20.17% 8.14% (7.16)***<br />
Q1 2009 136 11.59% 19.95% 8.36% (6.57)***<br />
lo Q4 2006 174 74.12% 64.68% -9.43% (-7.24)***<br />
Q2 2007 177 75.85% 64.85% -11.00% (-8.02)***<br />
Q2 2008 172 75.86% 65.67% -10.19% (-7.32)***<br />
Q1 2009 136 72.51% 64.82% -7.69% (-5.03)***<br />
ci_lo Q4 2006 174 10.06% 9.56% -0.50% (-0.93)<br />
Q2 2007 177 9.88% 9.60% -0.27% (-0.51)<br />
Q2 2008 172 9.80% 9.77% -0.03% (-0.04)<br />
Q1 2009 136 72.51% 9.52% -62.99% (-0.42)<br />
cc_lo Q4 2006 174 1.79% 4.79% 3.01% (8.03)***<br />
Q2 2007 177 1.78% 4.64% 2.86% (7.77)***<br />
Q2 2008 172 1.60% 4.35% 2.75% (7.68)***<br />
Q1 2009 136 1.45% 4.05% 2.59% (6.69)***<br />
agri_lo Q4 2006 174 1.11% 4.32% 3.21% (5.56)***<br />
Q2 2007 177 1.08% 4.49% 3.41% (5.74)***<br />
Q2 2008 172 0.93% 4.22% 3.29% (5.80)***<br />
Q1 2009 136 0.76% 3.95% 3.19% (5.26)***<br />
re_lo Q4 2006 174 60.19% 44.60% -15.60% (-10.95)***<br />
Q2 2007 177 62.06% 44.68% -17.38% (-12.02)***<br />
Q2 2008 172 62.52% 45.86% -16.67% (-11.22)***<br />
Q1 2009 136 59.88% 46.15% -13.73% (-8.40)***<br />
com_re_lo Q4 2006 174 19.26% 14.67% -4.59% (-5.57)***<br />
Q2 2007 177 19.50% 14.65% -4.85% (-5.94)***<br />
Q2 2008 172 20.21% 15.52% -4.70% (-5.44)***<br />
Q1 2009 136 21.62% 16.08% -5.54% (-5.63)***<br />
res_re_lo Q4 2006 174 15.47% 18.47% 3.00% (3.03)***<br />
Q2 2007 177 14.95% 18.22% 3.26% (3.31)***<br />
Q2 2008 172 15.11% 18.54% 3.43% (3.46)***<br />
Q1 2009 136 16.53% 19.09% 2.56% (2.30)**<br />
dvpt_re_lo Q4 2006 174 21.18% 7.29% -13.89% (-20.84)***<br />
Q2 2007 177 22.81% 7.57% -15.24% (-22.51)***<br />
Q2 2008 172 23.13% 7.58% -15.54% (-23.56)***<br />
Q1 2009 136 19.67% 6.71% -12.96% (-20.22)***<br />
non_perf_lo Q4 2006 174 1.76% 1.30% -0.46% (-4.48)***<br />
Q2 2007 177 2.41% 1.38% -1.03% (-9.31)***<br />
Q2 2008 172 5.80% 1.84% -3.96% (-27.94)***<br />
Q1 2009 136 7.99% 2.59% -5.40% (-27.35)***<br />
*, **, *** indicate statistical significance at 10, 5 and 1 percent levels, respectively.<br />
2-sided t-test using different variances for the two sub-samples.<br />
We see a slight decline in the ratios of securities to assets and loans to assets when we come closer<br />
to failure and when we go from Q4 2006 to Q1 2009. This decline is compensated by an increase<br />
- 36 -