Thesis_gd_final_vers.. - Vernimmen
Thesis_gd_final_vers.. - Vernimmen
Thesis_gd_final_vers.. - Vernimmen

Create successful ePaper yourself
Turn your PDF publications into a flip-book with our unique Google optimized e-Paper software.
ely more on alternative funding sources than safe ones, and this difference stays statistically<br />
significant when bankruptcy gets close, whereas we would have expected this alternative funding<br />
to dry up and disappear as financial distress increases. We do not have any information on FHLB<br />
advances, which may be included in this alternative funding sources, because this information is<br />
not publicly available. Several researchers pointed out the growing importance of FHLB advances<br />
as a funding source at small and community banks. For some banks, FHLB advances represented<br />
up to 20% of their total liabilities and were used to increase the volume of loans issued. With<br />
brokered deposits, FHLB advances are considered as non-risk priced non-core funding. Indeed<br />
interest rates paid either on deposits or on FHLB advances are only partially correlated to the<br />
riskiness of assets, which might have given failed banks the possibility to finance riskier assets<br />
without increasing their funding cost consistently with their risk-level.<br />
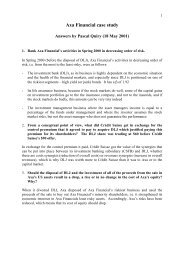
Table 10: Univariate tests of equality of the means between failed and safe banks (6/6)<br />
Variable<br />
Quarter<br />
failed<br />
banks<br />
Ratio for<br />
failed banks<br />
Ratio for safe<br />
banks<br />
Difference of<br />
means<br />
t-statistic<br />
ln_ta Q4 2006 174 12.49 11.84 -0.65 (-6.24)***<br />
Q2 2007 177 12.55 11.83 -0.72 ( -6.80)***<br />
Q2 2008 172 12.70 11.89 -0.81 (-7.64)***<br />
Q1 2009 136 12.63 11.96 -0.67 (-5.66)***<br />
growth Q4 2006 174 30.02% 11.20% -18.82% (-10.65)***<br />
Q2 2007 177 22.95% 11.23% -11.72% ( -6.66)***<br />
Q2 2008 172 15.95% 12.24% -3.71% (-2.13)**<br />
Q1 2009 136 1.65% 11.37% 9.72% (4.72)***<br />
Variable<br />
Quarter to<br />
failure<br />
failed<br />
banks<br />
Ratio for<br />
failed banks<br />
Ratio for safe<br />
banks<br />
Difference of<br />
means<br />
(t-statistic)<br />
ln_ta 1 140 12.66 11.76 -0.91 (-7.88)***<br />
4 140 12.70 11.76 -0.94 ( -6.80)***<br />
6 140 12.66 11.75 -0.90 (-7.84)***<br />
12 134 12.41 11.75 -0.66 (-5.63)***<br />
growth 1 140 0.30% 11.28% 10.99% (5.99)***<br />
4 140 17.45% 11.28% -6.17% (-3.36)***<br />
6 140 20.74% 12.24% -8.50% (-5.13)***<br />
12 134 36.36% 11.22% -25.15% (-13.17)***<br />
lag4_growth 1 140 20.95% 11.43% -9.52% (-5.21)***<br />
4 140 23.25% 11.41% -11.83% (-6.34)***<br />
6 140 29.93% 11.39% -18.54% (-9.80)***<br />
12 134 31.41% 11.32% -20.09% (-10.18)***<br />
*, **, *** indicate statistical significance at 10, 5 and 1 percent levels, respectively.<br />
2-sided t-test using different variances for the two sub-samples.<br />
Our findings on failed banks size contradict our hypothesis that failed banks are on average<br />
smaller than safe banks. On the contrary they are significantly larger. The growth rate of total<br />
- 42 -