Thesis_gd_final_vers.. - Vernimmen
Thesis_gd_final_vers.. - Vernimmen
Thesis_gd_final_vers.. - Vernimmen

Create successful ePaper yourself
Turn your PDF publications into a flip-book with our unique Google optimized e-Paper software.
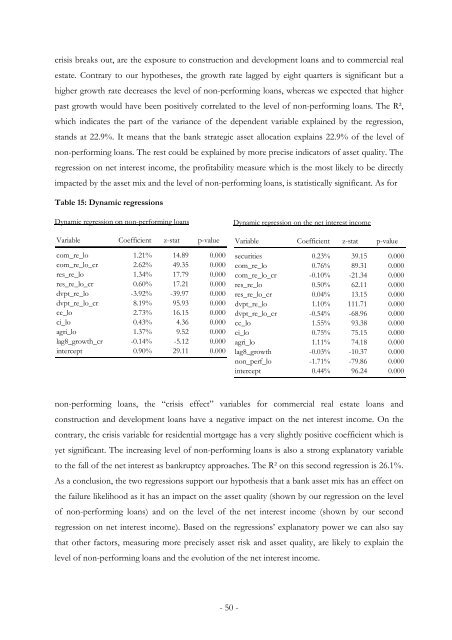
crisis breaks out, are the exposure to construction and development loans and to commercial real<br />
estate. Contrary to our hypotheses, the growth rate lagged by eight quarters is significant but a<br />
higher growth rate decreases the level of non-performing loans, whereas we expected that higher<br />
past growth would have been positively correlated to the level of non-performing loans. The R²,<br />
which indicates the part of the variance of the dependent variable explained by the regression,<br />
stands at 22.9%. It means that the bank strategic asset allocation explains 22.9% of the level of<br />
non-performing loans. The rest could be explained by more precise indicators of asset quality. The<br />
regression on net interest income, the profitability measure which is the most likely to be directly<br />
impacted by the asset mix and the level of non-performing loans, is statistically significant. As for<br />
Table 15: Dynamic regressions<br />
Dynamic regression on non-performing loans<br />
Variable Coefficient z-stat p-value<br />
com_re_lo 1.21% 14.89 0.000<br />
com_re_lo_cr 2.62% 49.35 0.000<br />
res_re_lo 1.34% 17.79 0.000<br />
res_re_lo_cr 0.60% 17.21 0.000<br />
dvpt_re_lo -3.92% -39.97 0.000<br />
dvpt_re_lo_cr 8.19% 95.93 0.000<br />
cc_lo 2.73% 16.15 0.000<br />
ci_lo 0.43% 4.36 0.000<br />
agri_lo 1.37% 9.52 0.000<br />
lag8_growth_cr -0.14% -5.12 0.000<br />
intercept 0.90% 29.11 0.000<br />
Dynamic regression on the net interest income<br />
Variable Coefficient z-stat p-value<br />
securities 0.23% 39.15 0.000<br />
com_re_lo 0.76% 89.31 0.000<br />
com_re_lo_cr -0.10% -21.34 0.000<br />
res_re_lo 0.50% 62.11 0.000<br />
res_re_lo_cr 0.04% 13.15 0.000<br />
dvpt_re_lo 1.10% 111.71 0.000<br />
dvpt_re_lo_cr -0.54% -68.96 0.000<br />
cc_lo 1.55% 93.38 0.000<br />
ci_lo 0.75% 75.15 0.000<br />
agri_lo 1.11% 74.18 0.000<br />
lag8_growth -0.03% -10.37 0.000<br />
non_perf_lo -1.71% -79.86 0.000<br />
intercept 0.44% 96.24 0.000<br />
non-performing loans, the “crisis effect” variables for commercial real estate loans and<br />
construction and development loans have a negative impact on the net interest income. On the<br />
contrary, the crisis variable for residential mortgage has a very slightly positive coefficient which is<br />
yet significant. The increasing level of non-performing loans is also a strong explanatory variable<br />
to the fall of the net interest as bankruptcy approaches. The R² on this second regression is 26.1%.<br />
As a conclusion, the two regressions support our hypothesis that a bank asset mix has an effect on<br />
the failure likelihood as it has an impact on the asset quality (shown by our regression on the level<br />
of non-performing loans) and on the level of the net interest income (shown by our second<br />
regression on net interest income). Based on the regressions’ explanatory power we can also say<br />
that other factors, measuring more precisely asset risk and asset quality, are likely to explain the<br />
level of non-performing loans and the evolution of the net interest income.<br />
- 50 -