HIERARCHAL INDUCTIVE PROCESS MODELING AND ANALYSIS ...
HIERARCHAL INDUCTIVE PROCESS MODELING AND ANALYSIS ...
HIERARCHAL INDUCTIVE PROCESS MODELING AND ANALYSIS ...

Create successful ePaper yourself
Turn your PDF publications into a flip-book with our unique Google optimized e-Paper software.
25<br />
20<br />
●<br />
P<br />
Z<br />
D<br />
N<br />
F<br />
●<br />
●<br />
●<br />
Median Activation Values<br />
15<br />
10<br />
●<br />
●<br />
5<br />
●<br />
●<br />
0<br />
● ● ●<br />
0.2 0.4 0.6 0.8 1.0<br />
ReMSE cutoff<br />
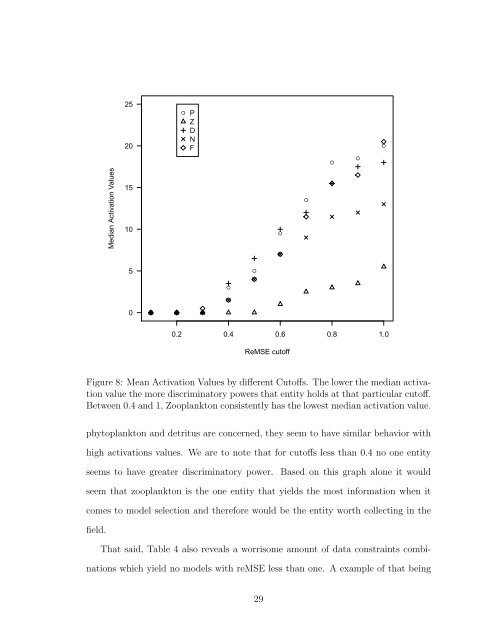
Figure 8: Mean Activation Values by different Cutoffs. The lower the median activation<br />
value the more discriminatory powers that entity holds at that particular cutoff.<br />
Between 0.4 and 1, Zooplankton consistently has the lowest median activation value.<br />
phytoplankton and detritus are concerned, they seem to have similar behavior with<br />
high activations values. We are to note that for cutoffs less than 0.4 no one entity<br />
seems to have greater discriminatory power. Based on this graph alone it would<br />
seem that zooplankton is the one entity that yields the most information when it<br />
comes to model selection and therefore would be the entity worth collecting in the<br />
field.<br />
That said, Table 4 also reveals a worrisome amount of data constraints combinations<br />
which yield no models with reMSE less than one. A example of that being<br />
29