HIERARCHAL INDUCTIVE PROCESS MODELING AND ANALYSIS ...
HIERARCHAL INDUCTIVE PROCESS MODELING AND ANALYSIS ...
HIERARCHAL INDUCTIVE PROCESS MODELING AND ANALYSIS ...

You also want an ePaper? Increase the reach of your titles
YUMPU automatically turns print PDFs into web optimized ePapers that Google loves.
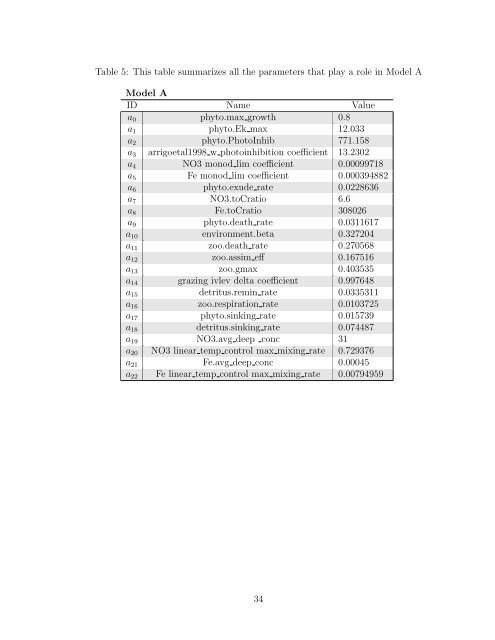
Table 5: This table summarizes all the parameters that play a role in Model A<br />
Model A<br />
ID Name Value<br />
a 0 phyto.max growth 0.8<br />
a 1 phyto.Ek max 12.033<br />
a 2 phyto.PhotoInhib 771.158<br />
a 3 arrigoetal1998 w photoinhibition coefficient 13.2302<br />
a 4 NO3 monod lim coefficient 0.00099718<br />
a 5 Fe monod lim coefficient 0.000394882<br />
a 6 phyto.exude rate 0.0228636<br />
a 7 NO3.toCratio 6.6<br />
a 8 Fe.toCratio 308026<br />
a 9 phyto.death rate 0.0311617<br />
a 10 environment.beta 0.327204<br />
a 11 zoo.death rate 0.270568<br />
a 12 zoo.assim eff 0.167516<br />
a 13 zoo.gmax 0.403535<br />
a 14 grazing ivlev delta coefficient 0.997648<br />
a 15 detritus.remin rate 0.0335311<br />
a 16 zoo.respiration rate 0.0103725<br />
a 17 phyto.sinking rate 0.015739<br />
a 18 detritus.sinking rate 0.074487<br />
a 19 NO3.avg deep conc 31<br />
a 20 NO3 linear temp control max mixing rate 0.729376<br />
a 21 Fe.avg deep conc 0.00045<br />
a 22 Fe linear temp control max mixing rate 0.00794959<br />
34