Financials - Deutsche EuroShop
Financials - Deutsche EuroShop
Financials - Deutsche EuroShop

You also want an ePaper? Increase the reach of your titles
YUMPU automatically turns print PDFs into web optimized ePapers that Google loves.
GRoup MAnAGeMent RepoRt results of operations, financial position and net assets<br />
0 50100 150 200<br />
In addition, the profit share of third-party shareholders rose by<br />
€ 7.8 million to € 15.7 million as a result of the expanded group of<br />
consolidated companies. In contrast, the profit from investments accounted<br />
for using the equity method improved by € 0.9 million, while<br />
income from investments and interest income were € 0.3 million below<br />
the previous year’s level.<br />
measurement gains / losses higher<br />
than in the prior year<br />
Measurement gains rose by € 8.7 million from € 33.1 million in the<br />
previous year to € 41.8 million. Remeasurement of the portfolio properties<br />
led to gains of € 51.6 million. On average the portfolio properties<br />
increased in value by 1.9% and, with two exceptions (which<br />
showed depreciations of 2.3% and 7.4%), market values were between<br />
+0.2% and +8.4% higher than the previous year.<br />
The initial and subsequent valuations of the Billstedt-Center and the<br />
Allee-Center Magdeburg generated measurement gains of € 11.1 million,<br />
while ancillary acquisition costs for the Billstedt-Center amounted<br />
to € 8.4 million.<br />
In addition, the acquisition of additional shareholdings in the Stadt-<br />
Galerie Hameln and the City-Galerie Wolfsburg led to a measurement<br />
loss of € 0.5 million. The purchase price of the shareholdings<br />
in the City-Galerie Wolfsburg exceeded the redemption entitlements<br />
of the former limited partners recognised in the accounts at the time<br />
of transfer.<br />
The share of measurement gains attributable to third-party shareholders<br />
rose in the reporting year to € 11.9 million (2010: € 3.0 million).<br />
significant change in tax position<br />
The tax burden in the year under review amounted to € 35.0 million,<br />
down by € 69.8 million on the previous year. The correction to tax<br />
expense in the previous year amounted to € 89.6 million, of which<br />
€ 87.5 million was for deferred trade tax and € 2.1 million for backpayments<br />
of trade tax for 2010 and previous years. The reporting<br />
year’s tax expense is composed of € 31.6 million in deferred income<br />
tax and income tax payments on current profit of € 3.4 million (domestic:<br />
€ 2.8 million, foreign: € 0.6 million).<br />
significant increase in consolidated profit<br />
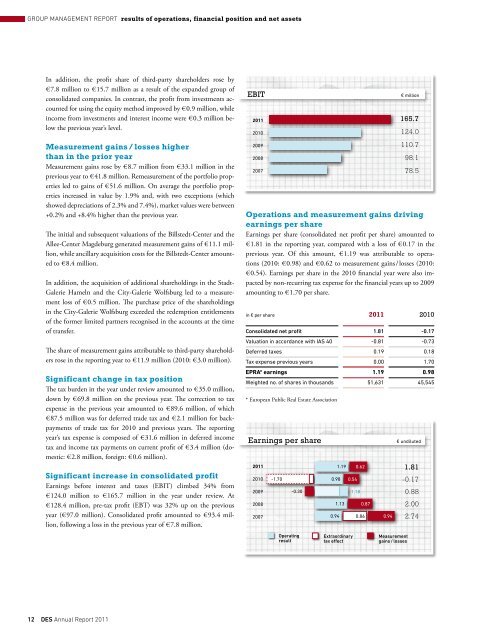
Earnings before interest and taxes (EBIT) climbed 34% from<br />
€ 124.0 million to € 165.7 million in the year under review. At<br />
€ 128.4 million, pre-tax profit (EBT) was 32% up on the previous<br />
year (€ 97.0 million). Consolidated profit amounted to € 93.4 million,<br />
following a loss in the previous year of € 7.8 million.<br />
12 Des Annual Report 2011<br />
EBIT € million<br />
2011<br />
2010<br />
2009<br />
2008<br />
2007<br />
165.7<br />
124.0<br />
110.7<br />
98.1<br />
78.5<br />
operations and measurement gains driving<br />
earnings per share<br />
Earnings per share (consolidated net profit per share) amounted to<br />
€ 1.81 in the reporting year, compared with a loss of € 0.17 in the<br />
previous year. Of this amount, € 1.19 was attributable to operations<br />
(2010: € 0.98) and € 0.62 to measurement gains / losses (2010:<br />
€ 0.54). Earnings per share in the 2010 financial year were also impacted<br />
by non-recurring tax expense for the financial years up to 2009<br />
amounting to € 1.70 per share.<br />
in € per share 2011 2010<br />
Consolidated net profit 1.81 -0.17<br />
Valuation in accordance with IAS 40 -0.81 -0.73<br />
Deferred taxes 0.19 0.18<br />
Tax expense previous years 0.00 1.70<br />
EPRA* earnings 1.19 0.98<br />
Weighted no. of shares in thousands 51,631 45,545<br />
* European Public Real Estate Association<br />
0,0 0,5 1,0 1,5 2,0 2,5 3,0 3,5<br />
Earnings per share € undiluted<br />
2011<br />
2010<br />
2009<br />
2008<br />
2007<br />
-1.70 0.98<br />
-0.30<br />
operating<br />
result<br />
0.94<br />
1.19<br />
1.13<br />
0.54<br />
extraordinary<br />
tax effect<br />
1.18<br />
0.62<br />
0.87<br />
0.86 0.94<br />
Measurement<br />
gains / losses<br />
1.81<br />
-0.17<br />
0.88<br />
2.00<br />
2.74