Financials - Deutsche EuroShop
Financials - Deutsche EuroShop
Financials - Deutsche EuroShop

You also want an ePaper? Increase the reach of your titles
YUMPU automatically turns print PDFs into web optimized ePapers that Google loves.
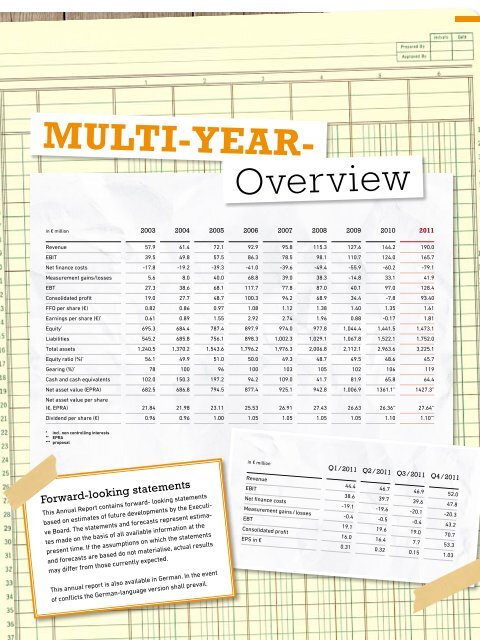
multi-year-<br />
overview<br />
in € million 2003 2004 2005 2006 2007 2008 2009 2010 2011<br />
Revenue 57.9 61.4 72.1 92.9 95.8 115.3 127.6 144.2 190.0<br />
EBIT 39.5 49.8 57.5 86.3 78.5 98.1 110.7 124.0 165.7<br />
Net finance costs -17.8 -19.2 -39.3 -41.0 -39.6 -49.4 -55.9 -60.2 -79.1<br />
Measurement gains/losses 5.6 8.0 40.0 68.8 39.0 38.3 -14.8 33.1 41.9<br />
EBT 27.3 38.6 68.1 117.7 77.8 87.0 40.1 97.0 128.4<br />
Consolidated profit 19.0 27.7 48.7 100.3 94.2 68.9 34.4 -7.8 93.40<br />
FFO per share (€) 0.82 0.86 0.97 1.08 1.12 1.38 1.40 1.35 1.61<br />
Earnings per share (€) * 0.61 0.89 1.55 2.92 2.74 1.96 0.88 -0.17 1.81<br />
Equity * 695.3 684.4 787.4 897.9 974.0 977.8 1,044.4 1,441.5 1,473.1<br />
Liabilities 545.2 685.8 756.1 898.3 1,002.3 1,029.1 1,067.8 1,522.1 1,752.0<br />
Total assets 1,240.5 1,370.2 1,543.6 1,796.2 1,976.3 2,006.8 2,112.1 2,963.6 3,225.1<br />
Equity ratio (%) * 56.1 49.9 51.0 50.0 49.3 48.7 49.5 48.6 45.7<br />
Gearing (%) * 78 100 96 100 103 105 102 106 119<br />
Cash and cash equivalents 102.0 150.3 197.2 94.2 109.0 41.7 81.9 65.8 64.4<br />
Net asset value (EPRA) 682.5 686.8 794.5 877.4 925.1 942.8 1,006.9 1361.1 ** 1427.3 **<br />
Net asset value per share<br />
(€, EPRA) 21.84 21.98 23.11 25.53 26.91 27.43 26.63 26.36 ** 27.64 **<br />
Dividend per share (€) 0.96 0.96 1.00 1.05 1.05 1.05 1.05 1.10 1.10 ***<br />
* incl. non controlling interests<br />
** eprA<br />
*** proposal<br />
Forward-looking statements<br />
This Annual Report contains forward- looking statements<br />
based on estimates of future developments by the Executive<br />
Board. The statements and forecasts represent estimates<br />
made on the basis of all available information at the<br />
present time. If the assumptions on which the statements<br />
and forecasts are based do not materialise, actual results<br />
may differ from those currently expected.<br />
This annual report is also available in German. In the event<br />
of conflicts the German-language version shall prevail.<br />
in € million q1 / 2011 q2 / 2011 q3 / 2011 q4 / 2011<br />
Revenue 44.4 46.7 46.9 52.0<br />
EBIT 38.6 39.7 39.6 47.8<br />
Net finance costs -19.1 -19.6 -20.1 -20.3<br />
Measurement gains / losses -0.4 -0.5 -0.4 43.2<br />
EBT 19.1 19.6 19.0 70.7<br />
Consolidated profit 16.0 16.4 7.7 53.3<br />
EPS in € 0.31 0.32 0.15 1.03