Comprehensive approaches to 3D inversion of magnetic ... - CGISS
Comprehensive approaches to 3D inversion of magnetic ... - CGISS
Comprehensive approaches to 3D inversion of magnetic ... - CGISS

You also want an ePaper? Increase the reach of your titles
YUMPU automatically turns print PDFs into web optimized ePapers that Google loves.
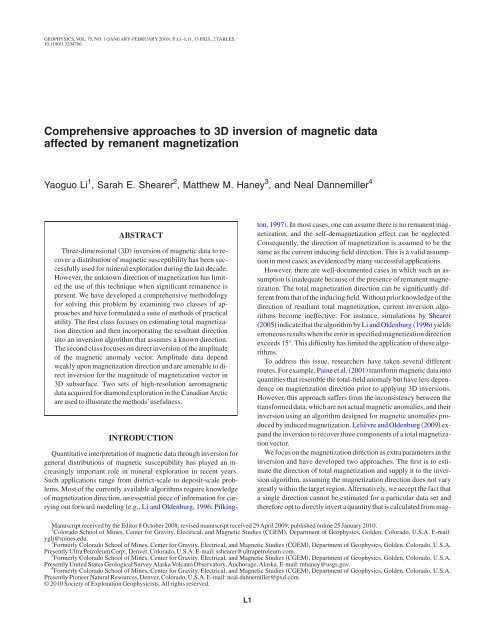
GEOPHYSICS, VOL. 75, NO. 1 JANUARY-FEBRUARY 2010; P. L1–L11, 13 FIGS., 2 TABLES.<br />
10.1190/1.3294766<br />
<strong>Comprehensive</strong> <strong>approaches</strong> <strong>to</strong> <strong>3D</strong> <strong>inversion</strong> <strong>of</strong> <strong>magnetic</strong> data<br />
affected by remanent magnetization<br />
Yaoguo Li 1 , Sarah E. Shearer 2 , Matthew M. Haney 3 , and Neal Dannemiller 4<br />
ABSTRACT<br />
Three-dimensional <strong>3D</strong> <strong>inversion</strong> <strong>of</strong> <strong>magnetic</strong> data <strong>to</strong> recover<br />
a distribution <strong>of</strong> <strong>magnetic</strong> susceptibility has been successfully<br />
used for mineral exploration during the last decade.<br />
However, the unknown direction <strong>of</strong> magnetization has limited<br />
the use <strong>of</strong> this technique when significant remanence is<br />
present. We have developed a comprehensive methodology<br />
for solving this problem by examining two classes <strong>of</strong> <strong>approaches</strong><br />
and have formulated a suite <strong>of</strong> methods <strong>of</strong> practical<br />
utility. The first class focuses on estimating <strong>to</strong>tal magnetization<br />
direction and then incorporating the resultant direction<br />
in<strong>to</strong> an <strong>inversion</strong> algorithm that assumes a known direction.<br />
The second class focuses on direct <strong>inversion</strong> <strong>of</strong> the amplitude<br />
<strong>of</strong> the <strong>magnetic</strong> anomaly vec<strong>to</strong>r. Amplitude data depend<br />
weakly upon magnetization direction and are amenable <strong>to</strong> direct<br />
<strong>inversion</strong> for the magnitude <strong>of</strong> magnetization vec<strong>to</strong>r in<br />
<strong>3D</strong> subsurface. Two sets <strong>of</strong> high-resolution aero<strong>magnetic</strong><br />
data acquired for diamond exploration in the CanadianArctic<br />
are used <strong>to</strong> illustrate the methods’usefulness.<br />
INTRODUCTION<br />
Quantitative interpretation <strong>of</strong> <strong>magnetic</strong> data through <strong>inversion</strong> for<br />
general distributions <strong>of</strong> <strong>magnetic</strong> susceptibility has played an increasingly<br />
important role in mineral exploration in recent years.<br />
Such applications range from district-scale <strong>to</strong> deposit-scale problems.<br />
Most <strong>of</strong> the currently available algorithms require knowledge<br />
<strong>of</strong> magnetization direction, an essential piece <strong>of</strong> information for carrying<br />
out forward modeling e.g., Li and Oldenburg, 1996; Pilking<strong>to</strong>n,<br />
1997. In most cases, one can assume there is no remanent magnetization,<br />
and the self-demagnetization effect can be neglected.<br />
Consequently, the direction <strong>of</strong> magnetization is assumed <strong>to</strong> be the<br />
same as the current inducing field direction. This is a valid assumption<br />
in most cases, as evidenced by many successful applications.<br />
However, there are well-documented cases in which such an assumption<br />
is inadequate because <strong>of</strong> the presence <strong>of</strong> remanent magnetization.<br />
The <strong>to</strong>tal magnetization direction can be significantly different<br />
from that <strong>of</strong> the inducing field. Without prior knowledge <strong>of</strong> the<br />
direction <strong>of</strong> resultant <strong>to</strong>tal magnetization, current <strong>inversion</strong> algorithms<br />
become ineffective. For instance, simulations by Shearer<br />
2005 indicate that the algorithm by Li and Oldenburg 1996 yields<br />
erroneous results when the error in specified magnetization direction<br />
exceeds 15°. This difficulty has limited the application <strong>of</strong> these algorithms.<br />
To address this issue, researchers have taken several different<br />
routes. For example, Paine et al. 2001 transform <strong>magnetic</strong> data in<strong>to</strong><br />
quantities that resemble the <strong>to</strong>tal-field anomaly but have less dependence<br />
on magnetization direction prior <strong>to</strong> applying <strong>3D</strong> <strong>inversion</strong>s.<br />
However, this approach suffers from the inconsistency between the<br />
transformed data, which are not actual <strong>magnetic</strong> anomalies, and their<br />
<strong>inversion</strong> using an algorithm designed for <strong>magnetic</strong> anomalies produced<br />
by induced magnetization. Lelièvre and Oldenburg 2009 expand<br />
the <strong>inversion</strong> <strong>to</strong> recover three components <strong>of</strong> a <strong>to</strong>tal magnetization<br />
vec<strong>to</strong>r.<br />
We focus on the magnetization direction as extra parameters in the<br />
<strong>inversion</strong> and have developed two <strong>approaches</strong>. The first is <strong>to</strong> estimate<br />
the direction <strong>of</strong> <strong>to</strong>tal magnetization and supply it <strong>to</strong> the <strong>inversion</strong><br />
algorithm, assuming the magnetization direction does not vary<br />
greatly within the target region.Alternatively, we accept the fact that<br />
a single direction cannot be estimated for a particular data set and<br />
therefore opt <strong>to</strong> directly invert a quantity that is calculated from mag-<br />
Manuscript received by the Edi<strong>to</strong>r 8 Oc<strong>to</strong>ber 2008; revised manuscript received 29April 2009; published online 25 January 2010.<br />
1 Colorado School <strong>of</strong> Mines, Center for Gravity, Electrical, and Magnetic Studies CGEM, Department <strong>of</strong> Geophysics, Golden, Colorado, U.S.A. E-mail:<br />
ygli@mines.edu.<br />
2 Formerly Colorado School <strong>of</strong> Mines, Center for Gravity, Electrical, and Magnetic Studies CGEM, Department <strong>of</strong> Geophysics, Golden, Colorado, U.S.A.<br />
Presently Ultra Petroleum Corp., Denver, Colorado, U.S.A. E-mail: sshearer@ultrapetroleum.com.<br />
3 Formerly Colorado School <strong>of</strong> Mines, Center for Gravity, Electrical, and Magnetic Studies CGEM, Department <strong>of</strong> Geophysics, Golden, Colorado, U.S.A.<br />
Presently United States Geological SurveyAlaska Volcano Observa<strong>to</strong>ry,Anchorage,Alaska. E-mail: mhaney@usgs.gov.<br />
4 Formerly Colorado School <strong>of</strong> Mines, Center for Gravity, Electrical, and Magnetic Studies CGEM, Department <strong>of</strong> Geophysics, Golden, Colorado, U.S.A.<br />
Presently Pioneer Natural Resources, Denver, Colorado, U.S.A. E-mail: neal.dannemiller@pxd.com.<br />
© 2010 Society <strong>of</strong> Exploration Geophysicists.All rights reserved.<br />
L1
L2<br />
Li et al.<br />
netic data but is weakly dependent upon magnetization direction.<br />
Based on these two methods, we have formulated a comprehensive<br />
approach <strong>to</strong> interpret any <strong>magnetic</strong> data affected by significant remanent<br />
magnetization.<br />
We first present three methods <strong>to</strong> estimate magnetization direction<br />
for use in subsequent <strong>inversion</strong>s and evaluate the performance in interpreting<br />
<strong>3D</strong> <strong>magnetic</strong> data with strong remanent magnetization.<br />
Then we present the basics <strong>of</strong> <strong>3D</strong> <strong>inversion</strong> <strong>of</strong> amplitude data that are<br />
weakly dependent upon magnetization direction. Both <strong>approaches</strong><br />
are illustrated with synthetic and field data sets from diamond exploration.<br />
We conclude by discussing the conditions and limitations <strong>of</strong><br />
the two <strong>approaches</strong> and thereby provide explicit guidance on choosing<br />
appropriate strategies for interpreting any <strong>magnetic</strong> data through<br />
<strong>3D</strong> <strong>inversion</strong>.<br />
ESTIMATING MAGNETIZATION DIRECTION<br />
Current <strong>3D</strong> <strong>magnetic</strong> <strong>inversion</strong> algorithms usually assume a<br />
known magnetization direction and construct the <strong>3D</strong> distribution <strong>of</strong><br />
<strong>magnetic</strong> susceptibility or magnitude <strong>of</strong> magnetization as a function<br />
<strong>of</strong> <strong>3D</strong> position Li and Oldenburg, 1996; Pilking<strong>to</strong>n, 1997. Given<br />
the critical role <strong>of</strong> magnetization direction, it is reasonable <strong>to</strong> attempt<br />
<strong>to</strong> estimate it independently prior <strong>to</strong> <strong>inversion</strong>. This is perhaps the<br />
simplest and most straightforward modification <strong>to</strong> the aforementioned<br />
algorithms. We develop this approach by first examining direction<br />
estimation techniques and then evaluating its utility in <strong>3D</strong> <strong>inversion</strong>s.<br />
Many workers recognize the importance <strong>of</strong> magnetization direction<br />
in interpreting <strong>magnetic</strong> data. For example, Zietz and Andreasen<br />
1967 examine the relationship between position and intensity<br />
<strong>of</strong> the maximum and minimum produced by a simple causative<br />
body. Roest and Pilking<strong>to</strong>n 1993 correlate the amplitude <strong>of</strong> the 2D<br />
<strong>to</strong>tal gradient <strong>of</strong> the <strong>magnetic</strong> field and the absolute value <strong>of</strong> the horizontal<br />
gradient <strong>of</strong> the pseudogravity produced by 2D sources.<br />
Lourenco and Morrison 1973 develop a method based upon the integral<br />
relationships <strong>of</strong> <strong>magnetic</strong> moments derived by Helbig 1962.<br />
More recently, Haney and Li 2002 develop a wavelet-based method<br />
for determining magnetization direction in 2D data sets. Dannemiller<br />
and Li 2006 introduce an improvement <strong>to</strong> Roest and Pilking<strong>to</strong>n’s<br />
1993 method and extend it <strong>to</strong> <strong>3D</strong> cases.<br />
For this paper, we present Helbig’s moment method, wavelet<br />
method, and cross-correlation method. The first two methods directly<br />
explore the relation between the anomaly and magnetization direction<br />
and compute magnetization direction from the data; whereas,<br />
the third method estimates magnetization direction using the<br />
symmetry property <strong>of</strong> the reduced-<strong>to</strong>-pole RTP field. In all three<br />
methods, we assume magnetization direction does not vary drastically<br />
for sources within the volume under examination.<br />
Once the direction is estimated, it can be incorporated in<strong>to</strong> a commonly<br />
used <strong>inversion</strong> algorithm that assumes a known magnetization<br />
direction. The <strong>inversion</strong> proceeds with the estimated magnetization<br />
direction and attempts <strong>to</strong> recover an effective susceptibility defined<br />
as the ratio <strong>of</strong> the magnitude <strong>of</strong> magnetization over the strength<br />
<strong>of</strong> the inducing <strong>magnetic</strong> field H 0 . In the following, we present the<br />
salient features <strong>of</strong> the estimation methods. We then illustrate the <strong>inversion</strong><br />
using such estimates through application <strong>to</strong> a synthetic example.<br />
Helbig’s moment method<br />
Helbig’s method Lourenco and Morrison, 1973; Phillips, 2005<br />
is based on the integral relations between the moments <strong>of</strong> a <strong>magnetic</strong><br />
anomaly and the <strong>magnetic</strong> dipole moment developed by Helbig<br />
1962:<br />
<br />
<br />
<br />
<br />
<br />
<br />
<br />
<br />
<br />
xB z x,ydxdy2m x ,<br />
yB z x,ydxdy2m y ,<br />
xB x x,ydxdy2m z ,<br />
where B x , B y , and B z are, respectively, the x-, y-, and z-components <strong>of</strong><br />
the <strong>magnetic</strong> anomaly and where m x , m y , and m z are the three components<br />
<strong>of</strong> the <strong>magnetic</strong> moment <strong>of</strong> the source. Once the <strong>magnetic</strong> moment<br />
is estimated, it can be used <strong>to</strong> calculate the inclination and declination<br />
<strong>of</strong> the magnetization, assuming they are constant within the<br />
source body.Although the integral relationships in equation 1 do not<br />
assume any specific source geometry, we have observed that the<br />
method is best applied <strong>to</strong> data sets produced by compact source bodies.<br />
Two scenarios arise in practical applications. First, we usually<br />
have only the <strong>to</strong>tal-field anomaly data and need <strong>to</strong> calculate the three<br />
components from the <strong>to</strong>tal-field anomaly by the corresponding<br />
wavenumber-domain opera<strong>to</strong>rs e.g., Pedersen, 1978; Blakely,<br />
1996; Schmidt and Clark, 1998. Difficulties may arise when the<br />
data are acquired in low <strong>magnetic</strong> latitudes because the conversion<br />
involves a half-reduction <strong>to</strong> the pole. Therefore, additional efforts<br />
are required near the <strong>magnetic</strong> equa<strong>to</strong>r. Alternatively, vec<strong>to</strong>r <strong>magnetic</strong><br />
surveys are now becoming available e.g., Dransfield et al.,<br />
2003, and the observed three-component data can be used directly<br />
in the estimation.<br />
Wavelet multiscale edge method<br />
Haney and Li 2002 develop a method for estimating the magnetization<br />
direction in two domensions using multiscale edges <strong>of</strong> a<br />
<strong>magnetic</strong> anomaly derived by a continuous wavelet transform. The<br />
multiscale edges correspond <strong>to</strong> the trajec<strong>to</strong>ries <strong>of</strong> the extrema <strong>of</strong> the<br />
wavelet transform <strong>of</strong> the anomaly pr<strong>of</strong>ile, and their positions in the<br />
x-z-plane are dependent upon the inclination <strong>of</strong> magnetization.<br />
Tracking the multiscale edges allows one <strong>to</strong> determine the inclination<br />
<strong>of</strong> the magnetization in 2D sources.<br />
Given a pr<strong>of</strong>ile <strong>of</strong> <strong>magnetic</strong> data collected at a height z 0 in an ambient<br />
<strong>magnetic</strong> field with inclination I, a continuous wavelet transform<br />
CWT can be performed using a set <strong>of</strong> natural wavelets that is<br />
equivalent <strong>to</strong> the <strong>magnetic</strong> field produced by a line dipole in a particular<br />
direction Hornby et al., 1999. To estimate magnetization direction,<br />
we use a wavelet whose corresponding dipole orientation<br />
has an inclination <strong>of</strong> I. Such a wavelet leads <strong>to</strong> a CWT that is dependent<br />
upon magnetization direction only. Carrying out the calculation<br />
for multiple dilation fac<strong>to</strong>rs yields the complete wavelet transform.<br />
1
Magnetic <strong>inversion</strong> with remanence<br />
L3<br />
The magnitude <strong>of</strong> the multiscale edges depends on the source geometry,<br />
whereas the location depends primarily on the intrinsic<br />
properties <strong>of</strong> the source, i.e., the magnetization direction I m . For example,<br />
for a line <strong>of</strong> dipoles, there are four trajec<strong>to</strong>ries, given by<br />
sx cot I m 2<br />
3<br />
, x cot I m 3 4<br />
3<br />
, 2<br />
where s is the dilation fac<strong>to</strong>r and x is the location along the <strong>magnetic</strong><br />
pr<strong>of</strong>ile. The dipole line is assumed <strong>to</strong> be directly below x0. Given<br />
a pr<strong>of</strong>ile <strong>of</strong> <strong>magnetic</strong> data, the problem <strong>of</strong> estimating the direction <strong>of</strong><br />
magnetization becomes one <strong>of</strong> tracking the trajec<strong>to</strong>ries <strong>of</strong> the multiscale<br />
edges and calculating I m by regression according <strong>to</strong> equation 2.<br />
Although the above approach is developed for 2D problems, it can<br />
be applied <strong>to</strong> <strong>3D</strong> data sets with isolated anomalies. In such cases, we<br />
can integrate the data map in each <strong>of</strong> the two horizontal directions <strong>to</strong><br />
synthesize two pr<strong>of</strong>iles. Integrating in the easting direction simulates<br />
a pr<strong>of</strong>ile along a north-south traverse above a 2D source that strikes<br />
east-west. The translation invariant property <strong>of</strong> <strong>magnetic</strong> anomalies<br />
means that integrating the anomalous field is equivalent <strong>to</strong> adding<br />
<strong>3D</strong> bodies along the strike direction <strong>to</strong> build up a 2D causative body.<br />
The corresponding magnetization is given by the projection <strong>of</strong> the<br />
<strong>3D</strong> magnetization vec<strong>to</strong>r in the north-south cross section. Applying<br />
the wavelet estimation <strong>to</strong> this pr<strong>of</strong>ile produces the apparent inclination<br />
<strong>of</strong> the magnetization within the north-south section. Performing<br />
similar operations in the perpendicular direction yields the apparent<br />
inclination in the east-west section. The true inclination and declination<br />
<strong>of</strong> magnetization in the original <strong>3D</strong> source can then be reconstructed<br />
from these two apparent inclinations in the easting and<br />
northing cross sections, respectively.<br />
Crosscorrelation method<br />
The RTP anomaly theoretically has the least asymmetry <strong>of</strong> all<br />
<strong>magnetic</strong> anomalies produced by a given causative body. It follows<br />
that the vertical derivative <strong>of</strong> the RTPanomaly is also least asymmetrical.<br />
It has been shown that the <strong>to</strong>tal gradient amplitude <strong>of</strong> the gradient<br />
vec<strong>to</strong>r in three dimensions <strong>of</strong> the RTPanomaly is the envelope<br />
<strong>of</strong> the vertical derivative <strong>of</strong> the anomaly produced under arbitrary inducing-field<br />
and magnetization directions Haney et al., 2003.<br />
The envelope, by definition, is the most symmetric form. Using<br />
these properties, Dannemiller and Li 2006 develop a method <strong>to</strong> estimate<br />
magnetization by examining the symmetry <strong>of</strong> various RTP<br />
fields. This method is an extension <strong>of</strong> the 2D crosscorrelation method<br />
developed by Roest and Pilking<strong>to</strong>n 1993 <strong>to</strong> three dimensions<br />
and improves upon the latter by using two quantities that have the<br />
same decay rate with distance <strong>to</strong> the source.As a result, Dannemiller<br />
and Li’s 2006 approach also extends the crosscorrelation method<br />
<strong>to</strong> anomalies produced by dipping causative bodies.<br />
The method searches for the particular magnetization direction<br />
that yields the maximum symmetry in the resultant RTP field. The<br />
symmetry is measured by the crosscorrelation between the vertical<br />
derivative and <strong>to</strong>tal gradient <strong>of</strong> the RTP anomaly that is calculated<br />
using an assumed magnetization direction. These two quantities<br />
achieve the maximum correlation near the correct magnetization direction.<br />
The key operation <strong>of</strong> the method is the RTP process. Consequently,<br />
we will encounter difficulties at low <strong>magnetic</strong> latitudes as before.<br />
Fortunately, several stable RTP methods are available for low latitudes<br />
e.g, Hansen and Pawlowski, 1989; Mendonca and Silva,<br />
1993; Li and Oldenburg, 2001. There is also a trade-<strong>of</strong>f between the<br />
accuracy <strong>of</strong> estimated inclination and the accuracy <strong>of</strong> estimated declination.<br />
The accuracy <strong>of</strong> inclination improves as it <strong>approaches</strong><br />
90° or 90°, but the accuracy <strong>of</strong> the corresponding declination decreases.<br />
However, this does not pose a major problem because the influence<br />
<strong>of</strong> the declination becomes less important at high <strong>magnetic</strong><br />
latitudes.<br />
Synthetic example<br />
To illustrate the direction estimation algorithms and the utility <strong>of</strong><br />
the resultant magnetization direction, we apply them <strong>to</strong> a synthetic<br />
example consisting <strong>of</strong> a dipping dike buried in a non<strong>magnetic</strong> background.<br />
Figure 1 shows the model and the <strong>to</strong>tal-field anomalies with<br />
and without the influence <strong>of</strong> remanent magnetization. For simplicity,<br />
the effective susceptibility for both cases is set <strong>to</strong> 0.05 SI. The inducing-field<br />
direction for this model has an inclination <strong>of</strong> 65°, a declination<br />
<strong>of</strong> 25°, and a strength <strong>of</strong> B 0 50,000 nT. The <strong>to</strong>tal magnetization<br />
with remanence has an inclination <strong>of</strong> 45° and a declination <strong>of</strong><br />
75°. The negative anomaly <strong>to</strong>ward the northeast <strong>of</strong> the positive peak<br />
in the data map Figure 1b is primarily related <strong>to</strong> the altered magnetization<br />
direction.<br />
We first apply Helbig’s method <strong>to</strong> the data in Figure 1b <strong>to</strong> estimate<br />
the magnetization direction. To achieve this, we transform the <strong>to</strong>talfield<br />
anomaly in Figure 1b in<strong>to</strong> three orthogonal components <strong>of</strong> the<br />
anomalous <strong>magnetic</strong> field shown in Figure 2.Applying equation 1 <strong>to</strong><br />
these components yields an estimate <strong>of</strong> the <strong>magnetic</strong> source dipole<br />
moment. The corresponding magnetization direction is I m ,D m <br />
46°,61°.<br />
To apply the wavelet estimation, we first carry out integration in<br />
northing and easting directions, respectively, <strong>to</strong> simulate two <strong>to</strong>talfield<br />
pr<strong>of</strong>iles in the easting and northing directions Figure 3. The<br />
corresponding apparent inclination values <strong>of</strong> <strong>to</strong>tal magnetization are<br />
51° and 71° in easting and northing sections, respectively. The final<br />
estimate for the magnetization direction in three dimensions is<br />
I m ,D m 49°,68°. Last, we apply the crosscorrelation method.<br />
The vertical and <strong>to</strong>tal gradients <strong>of</strong> computed RTPfield achieve maximum<br />
correlation at I m ,D m 45°,80°, which yields our third estimate<br />
for the magnetization. Figure 4 displays the crosscorrelation<br />
map with the maximum point shown by the plus sign.<br />
Table 1 compares these three estimates with the true values. All<br />
three <strong>approaches</strong> provide reasonable estimates <strong>of</strong> the direction. The<br />
largest deviation between true and estimated directions in three dimensions<br />
is 10° Helbig’s method. This is well within the error <strong>to</strong>lerance<br />
<strong>of</strong> 15° for the assumed magnetization established by Shearer<br />
2005.<br />
We then use these estimated magnetization directions as input in a<br />
<strong>3D</strong> <strong>inversion</strong> algorithm Li and Oldenburg, 2003 <strong>to</strong> invert the data<br />
shown in Figure 1b. All three <strong>inversion</strong>s produce consistent models<br />
that represent the true dipping slab. For brevity, we only display the<br />
recovered effective susceptibility from the <strong>inversion</strong> using the magnetization<br />
direction from Helbig’s estimate Figure 5. We can see<br />
that the dip <strong>of</strong> the anomalous source body is clearly visible, and its<br />
horizontal and vertical extents are well defined. Overall, the recovered<br />
anomalous body is a good representation <strong>of</strong> the true model.<br />
For this synthetic example, the following observations can be<br />
made. All three estimation methods produce consistent and reliable<br />
estimates <strong>of</strong> the magnetization direction. Using these estimates, subsequent<br />
<strong>inversion</strong>s produce <strong>magnetic</strong> models that are excellent representations<br />
<strong>of</strong> the true model. Thus, the results amply demonstrate
L4<br />
Li et al.<br />
the validity <strong>of</strong> the two-step approach. It is also noteworthy, however,<br />
that the estimation methods all rely on the global property <strong>of</strong> the<br />
<strong>magnetic</strong> data set. The estimated direction effectively summarizes<br />
the bulk direction <strong>of</strong> the magnetization in the causative bodies. The<br />
validity <strong>of</strong> the estimated direction relies on the assumption that actual<br />
direction does not vary significantly. In practice, the applicability<br />
<strong>of</strong> the approach is therefore limited <strong>to</strong> anomalies produced by single<br />
a)<br />
sources <strong>of</strong> compact geometry. For more complex scenarios, and<br />
when the magnetization direction is expected <strong>to</strong> vary greatly within<br />
the region <strong>of</strong> interest, an alternative approach is needed.<br />
1000<br />
800<br />
B x<br />
Depth (m)<br />
400 200 0<br />
1000<br />
Northing (m)<br />
600<br />
400<br />
200<br />
b)<br />
Northing (m)<br />
c)<br />
Northing (m)<br />
800 600 400 200<br />
Northing (m)<br />
1000<br />
800<br />
600<br />
400<br />
200<br />
0<br />
1000<br />
800<br />
600<br />
400<br />
0<br />
0 200 400 600 800 1000<br />
Easting (m)<br />
0 200 400 600 800 1000<br />
T<br />
(nT)<br />
450<br />
400<br />
350<br />
300<br />
250<br />
200<br />
150<br />
100<br />
50<br />
0<br />
50<br />
100<br />
150<br />
Northing (m)<br />
Northing (m)<br />
0<br />
1000<br />
800<br />
600<br />
400<br />
200<br />
0<br />
1000<br />
800<br />
600<br />
400<br />
0 200 400 600 800 1000<br />
250<br />
B y<br />
200<br />
150<br />
100<br />
50<br />
0<br />
50<br />
100<br />
150<br />
200<br />
250<br />
300<br />
350<br />
0 200 400 600 800 1000 B<br />
(nT)<br />
B z<br />
200<br />
200<br />
0<br />
0 200 400 600 800 1000<br />
Easting (m)<br />
0<br />
0 200 400 600 800 1000<br />
Easting (m)<br />
Figure 1. A synthetic example with strong remanent magnetization.<br />
a Dipping body with an effective susceptibility <strong>of</strong> 0.05 SI. Totalfield<br />
data b with and c without remanent magnetization. The inducing<br />
field has I,D65°,25°, and the <strong>to</strong>tal magnetization<br />
direction in the presence <strong>of</strong> remanence is I m ,D m 45°,75°.<br />
Figure 2. Three orthogonal components <strong>of</strong> the <strong>magnetic</strong> anomaly<br />
vec<strong>to</strong>r computed from the <strong>to</strong>tal-field anomaly in Figure 1. The firs<strong>to</strong>rder<br />
moments <strong>of</strong> the x- and z-components yield the three components<br />
<strong>of</strong> the source <strong>magnetic</strong> dipole and therefore the magnetization<br />
direction.
Magnetic <strong>inversion</strong> with remanence<br />
L5<br />
INVERSION OF DATA WEAKLY DEPENDENT<br />
ON MAGNETIZATION DIRECTION<br />
Integrated mag (nT)<br />
Integrated mag (nT)<br />
3000<br />
2000<br />
1000<br />
0<br />
1000<br />
2000<br />
0 200 400 600 800 1000<br />
Easting (m)<br />
3000<br />
2000<br />
1000<br />
0<br />
1000<br />
2000<br />
0 200 400 600 800 1000<br />
Northing (m)<br />
Figure 3. Two synthesized pr<strong>of</strong>iles obtained from the data map<br />
shown in Figure 1b. The east-west pr<strong>of</strong>ile <strong>to</strong>p is obtained by integrating<br />
the map in the north-south direction; hence, it corresponds <strong>to</strong><br />
the anomaly produced by a 2D causative body with a north-south<br />
strike. The north-south pr<strong>of</strong>ile in the lower panel is obtained by integration<br />
in the east-west direction and corresponds <strong>to</strong> a 2D body with<br />
a strike in that direction. These pr<strong>of</strong>iles are used in wavelet estimation<br />
<strong>of</strong> the <strong>to</strong>tal magnetization direction.<br />
Inclination ( o )<br />
90<br />
75<br />
60<br />
45<br />
0.4 0.42<br />
0.46<br />
0.44<br />
0.48<br />
0.5<br />
0.6<br />
0.52<br />
30<br />
1801501209060<br />
30<br />
0 30 60 90 120 150 180<br />
Declination ( o )<br />
Figure 4. Crosscorrelation map between the <strong>to</strong>tal gradient <strong>of</strong> and vertical<br />
gradient <strong>of</strong> the RTP field computed from assumed inclination<br />
and declination <strong>of</strong> the magnetization. The crosscorrelation achieves<br />
maximum near the correct magnetization direction.<br />
0.58<br />
0.54<br />
0.56<br />
We now examine the more complex scenarios where a single estimated<br />
magnetization direction is no longer applicable. Such cases<br />
may arise if a geologic unit has undergone deformation because <strong>of</strong><br />
tec<strong>to</strong>nic activities so that the magnetization direction changes significantly<br />
within the source bodies, or when multiple source bodies acquire<br />
remanent magnetization at different times and have significantly<br />
different magnetization directions. The challenge faced in<br />
this case requires a completely new approach that does not rely on<br />
knowledge <strong>of</strong> magnetization direction. The <strong>inversion</strong> <strong>of</strong> data associated<br />
with <strong>magnetic</strong> anomalies but weakly dependent upon magnetization<br />
direction <strong>of</strong>fers the needed alternative.<br />
The amplitude <strong>of</strong> the anomalous <strong>magnetic</strong> field vec<strong>to</strong>r and the <strong>to</strong>tal<br />
gradient <strong>of</strong> the <strong>magnetic</strong> anomaly are independent <strong>of</strong> the magnetization<br />
direction in 2D problems Nabighian, 1972 because the amplitude<br />
<strong>of</strong> the <strong>magnetic</strong> anomaly vec<strong>to</strong>r is the envelope <strong>of</strong> each component<br />
<strong>of</strong> the vec<strong>to</strong>r. The same holds true for the amplitude <strong>of</strong> the<br />
gradient vec<strong>to</strong>r <strong>of</strong> a 2D field component and the derivative <strong>of</strong> the<br />
same field component in any direction. Although such a property<br />
does not extend exactly <strong>to</strong> <strong>3D</strong> problems, both quantities are only<br />
weakly dependent on magnetization direction. This is especially so<br />
when the anomaly has been transformed <strong>to</strong> the vertical component<br />
i.e., half RTP. This property provides the opportunity for direct <strong>inversion</strong><br />
<strong>of</strong> the anomaly amplitude or <strong>to</strong>tal gradient <strong>to</strong> recover the<br />
magnitude <strong>of</strong> magnetization without knowing its direction.<br />
Shearer and Li 2004 develop such an algorithm by formulating a<br />
generalized <strong>inversion</strong> using Tikhonov regularization and imposing a<br />
Table 1. Magnetization direction estimated using three<br />
different methods for the dipping-slab data set shown in<br />
Figure 1c. The deviation is defined as the angle between the<br />
true and estimated directions in three dimensions.<br />
Method<br />
Inclination<br />
°<br />
Declination<br />
°<br />
Deviation<br />
°<br />
True value 45 75<br />
Helbig’s method 46 61 9.8<br />
Wavelet method 49 68 6.2<br />
Crosscorrelation 45 80 3.5<br />
a)<br />
Depth (m)<br />
b)<br />
Northing (m)<br />
0<br />
200<br />
400<br />
1000<br />
800<br />
600<br />
400<br />
200<br />
0<br />
0 200 400 600 800 1000<br />
0 200 400 600 800 1000<br />
Easting (m)<br />
k<br />
(SI)<br />
0.070<br />
0.063<br />
0.056<br />
0.049<br />
0.042<br />
0.035<br />
0.028<br />
0.021<br />
0.014<br />
0.007<br />
0.000<br />
Figure 5. Effective susceptibility obtained through the <strong>inversion</strong> <strong>of</strong><br />
the synthetic data in Figure 1b with estimated direction <strong>of</strong> <strong>to</strong>tal magnetization<br />
from Helbig’s method shown in Table 1. The <strong>inversion</strong> is<br />
performed using the algorithm <strong>of</strong> Li and Oldenburg 1996. a Cross<br />
section at 500 m north. b Plan section at a depth <strong>of</strong> 125 m. The true<br />
position <strong>of</strong> the source body is shown by the black outline. The resultant<br />
model is a good representation <strong>of</strong> the true model. The peak value<br />
<strong>of</strong> effective susceptibility is consistent with the true value <strong>of</strong> 0.05 SI.
L6<br />
positivity constraint on the amplitude <strong>of</strong> magnetization. Shearer<br />
2005 carries out a detailed investigation <strong>of</strong> the approach and demonstrates<br />
that the amplitude data are far less dependent on magnetization<br />
direction than the <strong>to</strong>tal gradient data. Furthermore, the amplitude<br />
data preserve the low-wavenumber content in the data and<br />
therefore retain the signal from deeper causative bodies that is<br />
present in the <strong>to</strong>tal-field <strong>magnetic</strong> anomaly. Consequently, <strong>inversion</strong><br />
<strong>of</strong> amplitude data <strong>of</strong>fers a better alternative than does <strong>inversion</strong> <strong>of</strong> <strong>to</strong>tal<br />
gradient data. We describe the amplitude <strong>inversion</strong> below, but<br />
readers are referred <strong>to</strong> Shearer 2005 for more details. The <strong>inversion</strong><br />
<strong>of</strong> <strong>to</strong>tal gradient data is exactly parallel.<br />
Basic algorithm for amplitude <strong>inversion</strong><br />
The algorithm starts by calculating the amplitude <strong>of</strong> the anomalous<br />
<strong>magnetic</strong> field from the observed <strong>to</strong>tal-field anomaly. This is accomplished<br />
by first transforming the <strong>to</strong>tal-field anomaly in<strong>to</strong> the<br />
three orthogonal components in the x-, y-, and z-directions. The amplitude<br />
data are given by<br />
B a B a Bx 2 B y 2 B z 2 ,<br />
where B a are the amplitude and B x ,B y ,B z are the transformed <strong>magnetic</strong><br />
anomaly vec<strong>to</strong>rs. A common approach <strong>to</strong> obtain the three orthogonal<br />
components is <strong>to</strong> use the wavenumber-domain expressions<br />
e.g., Pedersen, 1978 when the data are located on a plane. Alternatively,<br />
equivalent-source techniques Dampney, 1969 can be used<br />
<strong>to</strong> carry out the transformation when ground data are acquired in areas<br />
with high <strong>to</strong>pographic relief. In such cases, the wavenumber-domain<br />
approach, which assumes that all observations lie on a planar<br />
surface, is inappropriate. The amplitude data are then treated as the<br />
input data and inverted <strong>to</strong> recover the distribution <strong>of</strong> magnetization<br />
as a function <strong>of</strong> <strong>3D</strong> position in the subsurface. One advantage <strong>of</strong> the<br />
approach is that it is not limited <strong>to</strong> a single anomaly nor does it require<br />
that adjacent anomalies have the same magnetization direction.<br />
Therefore, the approach is generally applicable <strong>to</strong> a wide range<br />
<strong>of</strong> problems where the source distribution is more complicated.<br />
The basic <strong>inversion</strong> algorithm follows that <strong>of</strong> Li and Oldenburg<br />
1996, 2003 in which the Tikhonov formalism is used <strong>to</strong> trade <strong>of</strong>f<br />
between the data misfit and the structural complexity <strong>of</strong> the recovered<br />
model. The data misfit is defined as<br />
N<br />
d <br />
i1<br />
B obs pre<br />
ai B ai<br />
i<br />
3<br />
2<br />
, 4<br />
where B obs ai and B pre ai are observed and predicted amplitude data, respectively,<br />
and i are the standard deviation <strong>of</strong> the amplitude data.<br />
Although we commonly assume a Gaussian distribution for errors in<br />
<strong>magnetic</strong> field component data, the corresponding errors in the computed<br />
amplitude data no longer follow such a distribution.<br />
The model objective function is chosen as<br />
m s w 2 z 0 2 dv<br />
V<br />
wz 0 <br />
x<br />
V<br />
y<br />
V<br />
x<br />
wz 0 <br />
y<br />
2<br />
dv<br />
2<br />
dv<br />
Li et al.<br />
z V<br />
wz 0 <br />
z<br />
2<br />
dv,<br />
where is the effective susceptibility, defined as the ratio <strong>of</strong> magnitude<br />
<strong>of</strong> magnetization over the strength <strong>of</strong> the inducing field H 0 , 0 is<br />
a reference model, and wz is a depth-weighting function. The inverse<br />
solution is given by the minimization <strong>of</strong> the <strong>to</strong>tal objective<br />
function, consisting <strong>of</strong> a weighted sum <strong>of</strong> d and m , subject <strong>to</strong> the<br />
constraint that the effective susceptibility must be nonnegative:<br />
5<br />
minimize d m<br />
subject <strong>to</strong> 0, 6<br />
where is the regularization parameter. The positivity is implemented<br />
by using a primal logarithmic barrier method Wright, 1997;<br />
Li and Oldenburg, 2003. The solution is obtained iteratively because<br />
nonlinearity is introduced by the positivity constraint and the<br />
nonlinear relationship between amplitude data and effective susceptibility.<br />
We discuss the basics <strong>of</strong> this aspect next, but readers are referred<br />
<strong>to</strong> Shearer 2005 for more details.<br />
We adopt a commonly used model representation that discretizes<br />
the model region in three dimensions in<strong>to</strong> a set <strong>of</strong> contiguous rectangular<br />
prisms by an orthogonal mesh, and we assume a constant effective<br />
susceptibility value within each prism. Under this assumption,<br />
each component <strong>of</strong> the <strong>magnetic</strong> anomaly vec<strong>to</strong>r is given by a matrix-vec<strong>to</strong>r<br />
product:<br />
d x G x ,<br />
d y G y ,<br />
d z G z ,<br />
where d x B x1 ,¯,B xN T is an algebraic vec<strong>to</strong>r holding the<br />
x-components <strong>of</strong> the anomalous <strong>magnetic</strong> field; d y and d z are similarly<br />
defined; 1 ,¯, M T is the vec<strong>to</strong>r <strong>of</strong> unknown effective<br />
susceptibility <strong>to</strong> be recovered; and G x , G y , and G z are the sensitivity<br />
matrices relating the respective components <strong>of</strong> anomalous <strong>magnetic</strong><br />
field <strong>to</strong> effective susceptibilities. The elements <strong>of</strong> the sensitivity matrices<br />
quantify the field produced at the ith observation location by a<br />
unit effective susceptibility in the jth prism.<br />
Assuming the susceptibility model is n at the nth iteration, substituting<br />
equation 7 in<strong>to</strong> equation 3 and differentiating B ai with respect<br />
<strong>to</strong> j yields<br />
n<br />
B ai<br />
B ai<br />
n j ·b ij,<br />
B ai<br />
where B n ai is the predicted anomalous <strong>magnetic</strong> vec<strong>to</strong>r at the ith observation<br />
location by the model n at the nth iteration and where b ij<br />
is the <strong>magnetic</strong> vec<strong>to</strong>r produced at the same location by a unit susceptibility<br />
in the jth prisms. Thus, the sensitivity has a simple and elegant<br />
form given by the inner product <strong>of</strong> the unit vec<strong>to</strong>r <strong>of</strong> the predicted<br />
<strong>magnetic</strong> field at the nth iteration and the <strong>magnetic</strong> field produced<br />
by a unit effective susceptibility in a prism. For computational<br />
purposes, this means we only need <strong>to</strong> compute and s<strong>to</strong>re the three<br />
sensitivity matrices corresponding <strong>to</strong> the three components <strong>of</strong> the<br />
field in equation 7 and calculate the sensitivity for the amplitude data<br />
by a sequence <strong>of</strong> matrix-vec<strong>to</strong>r multiplications when solving the<br />
minimization in equation 6.<br />
When calculating the three individual sensitivity matrices, we<br />
7<br />
8
Magnetic <strong>inversion</strong> with remanence<br />
L7<br />
must formally specify a magnetization direction. Given that we are<br />
utilizing the weak dependence <strong>of</strong> amplitude data on magnetization<br />
direction, it is sufficient <strong>to</strong> use the direction <strong>of</strong> the current-inducing<br />
field. Thus, the sensitivity is computed as if the magnetization vec<strong>to</strong>r<br />
were given by the product <strong>of</strong> the effective susceptibility and the inducing<br />
field. It is important <strong>to</strong> note, however, that the interpretation<br />
<strong>of</strong> the <strong>inversion</strong> result is independent <strong>of</strong> the direction <strong>of</strong> the inducing<br />
field. The strength <strong>of</strong> the inducing field, on the other hand, defines<br />
the magnitude <strong>of</strong> the <strong>to</strong>tal magnetization if desired.<br />
Revisiting the synthetic example<br />
We now return <strong>to</strong> the synthetic example shown in Figure 1 and illustrate<br />
the approach <strong>of</strong> amplitude-data <strong>inversion</strong>. To calculate the<br />
amplitude data, we must first convert the <strong>to</strong>tal-field anomaly in<strong>to</strong><br />
three orthogonal components in x-, y-, and z-directions as shown in<br />
Figure 2. The desired amplitude data shown in Figure 6a are obtained<br />
by equation 3. For comparison, Figure 6b displays the amplitude<br />
data for the same model when the magnetization is aligned with<br />
the inducing field. For consistency, we have added the same amount<br />
<strong>of</strong> noise <strong>to</strong> <strong>to</strong>tal-field anomalies in both cases prior <strong>to</strong> conversion <strong>to</strong><br />
amplitude data. The high degree <strong>of</strong> similarity between the two maps<br />
demonstrates the direction insensitivity <strong>of</strong> the amplitude data. Using<br />
the same mesh as in the previous <strong>inversion</strong>, we invert the amplitude<br />
data in Figure 6a.<br />
a)<br />
1000<br />
The result is shown in Figure 7, which can be compared with the<br />
model recovered using an estimated magnetization direction Figure<br />
5. The location and spatial extent <strong>of</strong> the anomalous body is recovered<br />
well, but the dip is less visible.Also, the peak value <strong>of</strong> the recovered<br />
effective susceptibility is much higher. Overall, however, the<br />
<strong>inversion</strong> result is much improved, compared <strong>to</strong> the inability <strong>to</strong> invert<br />
the original data without the magnetization direction when using<br />
existing algorithms.<br />
The lack <strong>of</strong> recovered dip is <strong>to</strong> be expected in this case. The reasons<br />
are tw<strong>of</strong>old. First, much <strong>of</strong> the dip information is encoded in the<br />
phase <strong>of</strong> <strong>magnetic</strong> anomaly, and that information is greatly diminished<br />
in the amplitude data. Second, the particular model does not<br />
have a pronounced elongation in dip direction, and the remaining<br />
phase information in amplitude data is not enough <strong>to</strong> constrain the<br />
dip. In general, the ability <strong>to</strong> recover the dip depends on the orientation<br />
<strong>of</strong> the magnetization relative <strong>to</strong> the geometry <strong>of</strong> the causative<br />
body and on its aspect ratio.Although not reproduced here for brevity,<br />
numerical tests have shown that the dip can be recovered when<br />
the depth extent <strong>of</strong> a causative body is much longer than its width.<br />
The peak value <strong>of</strong> the recovered effective susceptibility in the amplitude<br />
<strong>inversion</strong> is much higher than that in the <strong>inversion</strong> based on<br />
estimated magnetization direction. This difference has been observed<br />
consistently in all synthetic and field data examples that we<br />
have studied. This difference appears <strong>to</strong> be related <strong>to</strong> the following<br />
two fac<strong>to</strong>rs.<br />
First, because <strong>of</strong> the partial lack <strong>of</strong> the phase information in amplitude<br />
data, the recovered effective susceptibility tends <strong>to</strong> spread out<br />
800<br />
a)<br />
0<br />
Northing (m)<br />
b)<br />
Northing (m)<br />
600<br />
400<br />
200<br />
0<br />
1000<br />
800<br />
600<br />
400<br />
200<br />
0<br />
0 200 400 600 800 1000<br />
0 200 400 600 800 1000<br />
Easting (m)<br />
B a<br />
(nT)<br />
Figure 6. Comparison <strong>of</strong> amplitude data computed from the <strong>to</strong>talfield<br />
anomalies shown in Figure 1. a The amplitude data computed<br />
from the <strong>to</strong>tal-field anomaly in Figure 1b when the magnetization is<br />
affected by remanence. b Data computed from the <strong>to</strong>tal-field<br />
anomaly in Figure 1c when the magnetization is purely induced.<br />
600<br />
550<br />
500<br />
450<br />
400<br />
350<br />
300<br />
250<br />
200<br />
150<br />
100<br />
50<br />
0<br />
Depth (m)<br />
b)<br />
Northing (m)<br />
200<br />
400<br />
1000<br />
800<br />
600<br />
400<br />
200<br />
0<br />
0 200 400 600 800 1000<br />
0 200 400 600 800 1000<br />
Easting (m)<br />
k<br />
(SI)<br />
0.150<br />
0.135<br />
0.120<br />
0.105<br />
0.090<br />
0.075<br />
0.060<br />
0.045<br />
0.030<br />
0.015<br />
0.000<br />
Figure 7. Inversion <strong>of</strong> the amplitude data in Figure 6a using an amplitude-<strong>inversion</strong><br />
algorithm. The model is shown as effective susceptibility,<br />
which is defined by the magnitude <strong>of</strong> the magnetization<br />
vec<strong>to</strong>r divided by the strength <strong>of</strong> the inducing <strong>magnetic</strong> field. a<br />
Cross section at 500 m north. b Plan section at 125 m depth. The<br />
outline <strong>of</strong> the true source body is shown by the solid black line.
L8<br />
Li et al.<br />
more. There is essentially more susceptibility distributed at larger<br />
depth. Correspondingly, a higher peak value is required <strong>to</strong> reproduce<br />
the data. For example, the depths <strong>of</strong> the center <strong>of</strong> mass <strong>of</strong> the susceptibility<br />
are 200 and 280 m, respectively, in the models from <strong>inversion</strong><br />
using estimated direction Figure 5 and from amplitude <strong>inversion</strong><br />
Figure 7. The cube <strong>of</strong> the ratio <strong>of</strong> the two depths is 0.35. Given<br />
that the amplitude data decay approximately with inverse distance<br />
cubed, this ratio is consistent with the peak susceptibility ratio <strong>of</strong><br />
0.45.<br />
Second, every small anomalous feature in the amplitude data can<br />
be reproduced easily, so the data tend <strong>to</strong> be overfit when we use standard<br />
techniques for estimating the optimal data fit determined by the<br />
regularization parameter. This also leads <strong>to</strong> a greater peak susceptibility<br />
value in recovered models. However, the geometry <strong>of</strong> the recovered<br />
source body is similar for the two <strong>inversion</strong>s despite the difference<br />
in peak susceptibility values. Both models can be used <strong>to</strong><br />
carry out the final interpretation.<br />
The ability <strong>to</strong> invert amplitude data has effectively circumvented<br />
the need for magnetization direction as a crucial piece <strong>of</strong> information.<br />
As a result, we have bypassed the limitation <strong>of</strong> the first method<br />
that requires a constant magnetization direction within a source<br />
body. This opens the door <strong>to</strong> applying <strong>3D</strong> <strong>inversion</strong> <strong>to</strong> interpret a<br />
wide range <strong>of</strong> data sets, especially those from areas with complex geology<br />
and multiple source regions with variable magnetization directions.<br />
APPLICATION TO FIELD DATA SETS<br />
We now invert two sets <strong>of</strong> high-resolution aero<strong>magnetic</strong> data and<br />
illustrate the application <strong>of</strong> our methods in their respective scenarios.<br />
The data were acquired by TeckCominco and Diamonds North<br />
over kimberlites on Vic<strong>to</strong>ria Island in Northwest Terri<strong>to</strong>ry, Canada.<br />
The geology in the area is characterized by an Archean granitic<br />
basement overlain by a Proterozoic sedimentary sequence with minor<br />
volcanics, capped by flat-lying Cambrian-<strong>to</strong>-Devonian carbonate<br />
rocks. The host rocks are largely non<strong>magnetic</strong>, and the kimberlite<br />
bodies stand out in the <strong>magnetic</strong> surveys as distinct, sharp anomalies<br />
indicative <strong>of</strong> shallow bodies, compared with the more rounded<br />
anomalies caused by deep features in the basement or within the sedimentary<br />
rocks. Positive and negative anomalies are associated with<br />
kimberlite intrusions, whereas the negative anomalies are produced<br />
by hypabyssal dikes.<br />
The ages <strong>of</strong> the kimberlite intrusions range from 250 <strong>to</strong> 300 million<br />
years J. Lajoie, personal communication, 2004. The distinct<br />
<strong>magnetic</strong> signature <strong>of</strong> these kimberlite dikes above a quiet <strong>magnetic</strong><br />
background makes high-resolution <strong>magnetic</strong> surveys an ideal exploration<br />
<strong>to</strong>ol in this area. However, the highly variable orientation <strong>of</strong><br />
these anomalies is produced by magnetization that is dominated by<br />
strong remanence with variable direction. As a result, the quantitative<br />
interpretation <strong>of</strong> the anomalies is difficult <strong>to</strong> achieve through<br />
current <strong>3D</strong> <strong>inversion</strong> algorithms. For this reason, the data are ideal<br />
for testing our new <strong>approaches</strong>.<br />
We investigate data from two different areas with variable complexity<br />
in anomaly patterns. The first data set contains a single anomaly<br />
associated with a kimberlite dike; the second contains several<br />
different anomalies with large variations in magnetization direction.<br />
The data set containing a single anomaly is shown in Figure 8a.<br />
The inducing field has an inclination <strong>of</strong> 86.7° and declination <strong>of</strong><br />
26.3°. Given the high <strong>magnetic</strong> latitude and dominant negative<br />
anomaly, it is clear that the kimberlite has strong remanence, and the<br />
<strong>to</strong>tal magnetization is nearly in the opposite direction <strong>to</strong> the inducing<br />
field. Figure 8b displays the amplitude data computed from these<br />
data. Given the single anomaly in this data set, we can estimate the<br />
direction first and then invert the <strong>to</strong>tal-field data or we can directly<br />
invert the amplitude data. We present both for comparison.<br />
The results <strong>of</strong> estimation are listed in Table 2. The estimated values<br />
for inclination are similar, but the declination varies greatly. This<br />
is expected, given the inclination is close <strong>to</strong> 90°. When used in an<br />
<strong>inversion</strong>, the error in declination does not strongly affect the final<br />
result either. Using the direction estimated from multiscale edges,<br />
<strong>inversion</strong> <strong>of</strong> <strong>to</strong>tal-field data Figure 8a is shown in one cross section<br />
at 300 m north and one plan section at 50 m depth in Figure 9. The<br />
result from inverting the amplitude data is shown in the same format<br />
in Figure 10. The two <strong>inversion</strong>s recover models with similar geometry<br />
but differing peak susceptibility, as noted in the preceding section.<br />
Both effectively image a compact <strong>magnetic</strong> body. It has a northwest<br />
strike and a strike length <strong>of</strong> approximately 250 m, and it is located<br />
at 50 m depth <strong>to</strong> the center. This result is consistent with the<br />
presence <strong>of</strong> a kimberlite dike.<br />
The second data set is shown in Figure 11a. A number <strong>of</strong> dipolar<br />
<strong>to</strong>tal-field anomalies with differing orientations occur throughout<br />
the survey area. The map has been rotated clockwise by 34°; the inducing<br />
field has an inclination <strong>of</strong> 86.7° and a nominal declination <strong>of</strong><br />
7.7°. Two types <strong>of</strong> anomalies dominate the data set: several smaller,<br />
more compact, and high-frequency anomalies surrounding areas<br />
a)<br />
Northing (m)<br />
b)<br />
Northing (m)<br />
600<br />
400<br />
200<br />
0<br />
600<br />
400<br />
200<br />
0<br />
0 200 400 600 800<br />
0 200 400 600 800<br />
Easting (m)<br />
4<br />
3<br />
2<br />
1<br />
0<br />
1<br />
2<br />
3<br />
4<br />
5<br />
6<br />
7<br />
8<br />
T<br />
(nT)<br />
7.0<br />
6.5<br />
6.0<br />
5.5<br />
5.0<br />
4.5<br />
4.0<br />
3.5<br />
3.0<br />
2.5<br />
2.0<br />
1.5<br />
1.0<br />
0.5<br />
0.0<br />
B a<br />
(nT)<br />
Figure 8. a Total-field <strong>magnetic</strong> anomaly T over a kimberlite<br />
dike. The inducing field is in the direction <strong>of</strong> I86.7° and D<br />
26.3°. Judging from the negative anomaly in the center, the presence<br />
<strong>of</strong> strong remanent magnetization is apparent. b The corresponding<br />
amplitude, B a , <strong>of</strong> the anomalous field vec<strong>to</strong>r.
Magnetic <strong>inversion</strong> with remanence<br />
L9<br />
<strong>of</strong> broad, lower-frequency anomalies. The orientation <strong>of</strong> the anomalies<br />
indicates the <strong>to</strong>tal magnetization direction varies greatly from<br />
anomaly <strong>to</strong> anomaly. Thus, it is unlikely that we can invert this data<br />
set with a single magnetization direction. Overlapping anomalies<br />
also mean that separately inverting each anomaly by first estimating<br />
a magnetization direction is not feasible. We resort <strong>to</strong> the second approach,<br />
i.e., we invert the amplitude <strong>of</strong> the anomalous <strong>magnetic</strong> field<br />
and recover the magnitude <strong>of</strong> magnetization in the form <strong>of</strong> an effective<br />
susceptibility. The computed amplitude data are shown in Figure<br />
11b.<br />
The effective susceptibility recovered from the <strong>inversion</strong> <strong>of</strong> the<br />
amplitude data in Figure 11b is shown in Figure 12 as a volume-rendered<br />
image with an overlain translucent color display <strong>of</strong> the amplitude<br />
data. There are five main anomalous bodies <strong>of</strong> high susceptibility<br />
in the recovered model. The two broad, elongated bodies resemble<br />
kimberlite dikes known in this area, whereas the more compact bodies<br />
oriented vertically resemble kimberlite pipes.<br />
DISCUSSION<br />
Table 2. Magnetization direction estimated using three<br />
different methods for the field data set shown in Figure 8a.<br />
Method<br />
Inclination<br />
°<br />
Declination<br />
°<br />
Helbig’s method 84.7 70.0<br />
Wavelet method 89.3 1.8<br />
Crosscorrelation 87.4 26.0<br />
The methodology developed in this paper for inverting <strong>magnetic</strong><br />
data in the presence <strong>of</strong> remanent magnetization consists <strong>of</strong> two <strong>approaches</strong>.<br />
The first approach directly addresses the issue <strong>of</strong> unknown<br />
magnetization direction and estimates it using several existing and<br />
newly developed algorithms. The data are then inverted using existing<br />
<strong>magnetic</strong> <strong>inversion</strong> algorithms. The second approach circumvents<br />
the need for reliable knowledge <strong>of</strong> magnetization direction<br />
and, instead, inverts directly the amplitude <strong>of</strong> the anomalous field <strong>to</strong><br />
recover the magnitude <strong>of</strong> the magnetization.<br />
Figure 13 summarizes the three routes <strong>to</strong> the <strong>inversion</strong> <strong>of</strong> <strong>magnetic</strong><br />
data. For a given data set, the first question <strong>to</strong> be answered is<br />
whether the data are affected by strong remanent magnetization that<br />
is not aligned with the current inducing field. If the answer is no, then<br />
any standard <strong>inversion</strong> algorithms for <strong>3D</strong> <strong>magnetic</strong> <strong>inversion</strong> can be<br />
applied. If the answer is yes, the data set should be inverted by using<br />
one <strong>of</strong> two <strong>approaches</strong> depending on the complexity <strong>of</strong> the <strong>magnetic</strong><br />
anomaly. The criterion for choosing which method <strong>to</strong> use is whether<br />
a single magnetization direction is a valid assumption and can be estimated.<br />
If the answer is yes, then the method based on direction estimation<br />
should be used. In practice, this means that only a single<br />
compact anomaly is present, although rare cases <strong>of</strong> multiple anomalies<br />
with the same magnetization direction may exist. If the answer is<br />
no, then the amplitude-data <strong>inversion</strong> method should be used. Such<br />
cases include a single anomaly produced by a complex source body<br />
or multiple anomalies with different orientations.<br />
Both methods can effectively construct the source distribution for<br />
a compact source body that meets the assumption <strong>of</strong> a constant magnetization<br />
direction. However, when multiple source bodies are<br />
present with varying magnetization directions, amplitude-data <strong>inversion</strong><br />
proves <strong>to</strong> be much more versatile. The price we pay for that<br />
ability is, <strong>of</strong> course, the partially missing phase information in the<br />
data.As a result, the dip <strong>of</strong> the recovered source distribution may not<br />
be clearly imaged if the causative body does not have a pronounced<br />
a)<br />
Depth (m)<br />
b)<br />
Northing (m)<br />
0<br />
50<br />
100<br />
150<br />
200 300 400 500 600<br />
500<br />
400<br />
300<br />
200<br />
200 300 400 500 600<br />
Easting (m)<br />
1.0<br />
0.9<br />
0.8<br />
0.7<br />
0.6<br />
0.5<br />
0.4<br />
0.3<br />
0.2<br />
0.1<br />
0.0<br />
k<br />
(SI)<br />
Figure 9. Effective susceptibility recovered by inverting the <strong>to</strong>talfield<br />
<strong>magnetic</strong> anomaly in Figure 8a. The <strong>inversion</strong> uses the magnetization<br />
direction estimated by the multiscale edge method. a Cross<br />
section at 300 m north. b Plan section at 50 m depth.<br />
a)<br />
Depth (m)<br />
b)<br />
Northing (m)<br />
0<br />
50<br />
100<br />
150<br />
200 300 400 500 600<br />
500<br />
400<br />
300<br />
200<br />
200 300 400 500 600<br />
Easting (m)<br />
k<br />
(SI)<br />
0.020<br />
0.018<br />
0.016<br />
0.014<br />
0.012<br />
0.010<br />
0.008<br />
0.006<br />
0.004<br />
0.002<br />
0.000<br />
Figure 10. Effective susceptibility recovered by inverting the amplitude<br />
anomaly in Figure 8b. a Cross section at 300 m north. b Plan<br />
section at 50 m depth.
L10<br />
Li et al.<br />
a)<br />
Northing (m)<br />
b)<br />
Northing (m)<br />
1600<br />
1400<br />
1200<br />
1000<br />
1600<br />
1400<br />
1200<br />
1000<br />
400<br />
200<br />
0 200 400<br />
400<br />
200<br />
0 200 400<br />
Easting (m)<br />
6<br />
4<br />
2<br />
0<br />
2<br />
4<br />
6<br />
8<br />
10<br />
14 12<br />
<br />
16<br />
18<br />
20<br />
22<br />
24<br />
T<br />
(nT)<br />
26<br />
24<br />
22<br />
20<br />
18<br />
16<br />
14<br />
12<br />
10<br />
8<br />
6<br />
4<br />
2<br />
0<br />
B a<br />
(nT)<br />
Figure 11. a The <strong>to</strong>tal-field anomaly data over a group <strong>of</strong> kimberlites<br />
on Vic<strong>to</strong>ria Island, Northwest Terri<strong>to</strong>ries, Canada. The 600<br />
1000-m data have been rotated 34° clockwise and regridded at a<br />
10-m spacing. The rotated data map has an inducing field with an inclination<br />
<strong>of</strong> 86.7° and a nominal declination <strong>of</strong> 7.7°. b The corresponding<br />
amplitude <strong>of</strong> anomalous <strong>magnetic</strong> vec<strong>to</strong>r.<br />
0<br />
50<br />
100<br />
150<br />
200 –500<br />
–250<br />
0<br />
Easting (m) 250<br />
29.4<br />
24.6<br />
19.8<br />
14.9<br />
10.1<br />
5.24<br />
0.407<br />
500<br />
Ba (nT)<br />
Figure 12. Volume-rendered <strong>inversion</strong> results <strong>of</strong> the recovered effective<br />
susceptibility with a translucent color display <strong>of</strong> the amplitude<br />
data shown in Figure 11b. The view is from the southeast. The color<br />
scale indicates the amplitude data in nT; the effective susceptibility<br />
is cut <strong>of</strong>f at 0.025 SI. Five major <strong>magnetic</strong> sources are recovered. The<br />
two broad, elongated sources resemble kimberlite dikes known in<br />
this area; the more compact, vertically oriented bodies resemble<br />
kimberlite pipes in the area.<br />
Invert<br />
<strong>to</strong>tal field anomaly<br />
Magnetic<br />
susceptibility<br />
No<br />
Yes<br />
Estimate<br />
magnetization<br />
direction<br />
Invert<br />
<strong>to</strong>tal field anomaly<br />
Total-field anomaly<br />
Remanent<br />
magetization<br />
Single anomaly<br />
Magnitude <strong>of</strong><br />
magnetization<br />
elongation along its dip. Computationally, the cost <strong>of</strong> estimating a<br />
magnetization direction is negligible compared <strong>to</strong> the subsequent <strong>inversion</strong><br />
that uses the estimation. Therefore, this method incurs a <strong>to</strong>tal<br />
computational cost similar <strong>to</strong> <strong>3D</strong> <strong>inversion</strong> <strong>of</strong> purely induced <strong>magnetic</strong><br />
data. The amplitude <strong>inversion</strong> must generate and use three sensitivity<br />
matrices; hence, the <strong>to</strong>tal cost is approximately three times<br />
that <strong>of</strong> the first method.<br />
Our approach deals with the difficulty caused by unknown magnetization<br />
direction. In exploration problems, one such occurrence<br />
may be the result <strong>of</strong> the presence <strong>of</strong> remanent magnetization. Although<br />
our approach enables the <strong>inversion</strong> <strong>of</strong> data <strong>to</strong> obtain a <strong>3D</strong> distribution<br />
<strong>of</strong> magnitude <strong>of</strong> magnetization, it does not separate induced<br />
and remanent components. Another leading cause <strong>of</strong> unknown<br />
magnetization direction is the self-demagnetization effect in<br />
highly <strong>magnetic</strong> environments such as banded iron formations. The<br />
methods developed in this paper may apply <strong>to</strong> interpretation <strong>of</strong> data<br />
affected by self-demagnetization effect. This aspect is under investigation.<br />
CONCLUSION<br />
Yes<br />
We have developed a comprehensive set <strong>of</strong> methods <strong>to</strong> tackle the<br />
problem <strong>of</strong> inverting <strong>magnetic</strong> data in the presence <strong>of</strong> remanent<br />
magnetization that alters the direction <strong>of</strong> the <strong>to</strong>tal magnetization.<br />
Given these methods, we have a set <strong>of</strong> <strong>to</strong>ols at our disposal for interpreting<br />
<strong>magnetic</strong> data in the presence <strong>of</strong> significant remanent magnetization.<br />
Coupled with existing <strong>3D</strong> <strong>inversion</strong> algorithms, we can<br />
confidently state that most <strong>of</strong> the <strong>magnetic</strong> data acquired in exploration<br />
problems can be interpreted quantitatively by constructing <strong>3D</strong><br />
distributions <strong>of</strong> either <strong>magnetic</strong> susceptibility <strong>of</strong> the magnitude <strong>of</strong><br />
magnetization. This will further enhance the applicability and effectiveness<br />
<strong>of</strong> <strong>3D</strong> <strong>magnetic</strong> <strong>inversion</strong>.<br />
ACKNOWLEDGMENTS<br />
Compute<br />
amplitude data<br />
Invert<br />
amplitude data<br />
Figure 13. The three routes <strong>to</strong> the <strong>inversion</strong> <strong>of</strong> <strong>magnetic</strong> data. If the<br />
data are not affected by remanent magnetization, any standard <strong>inversion</strong><br />
algorithms for <strong>3D</strong> <strong>magnetic</strong> <strong>inversion</strong> can be applied. Otherwise,<br />
the data should be inverted by using one <strong>of</strong> the two <strong>approaches</strong><br />
developed here.<br />
We thank Jules Lajoie, TeckCominco, and Diamond North for<br />
providing the data used in the study. We also thank Misac Nabighian<br />
and Jeff Phillips for many discussions. Finally, we thank Richard<br />
Lane, Peter Lelièvre, and an anonymous reviewer for detailed comments<br />
that improved the clarity <strong>of</strong> the presentation. This work was<br />
No
Magnetic <strong>inversion</strong> with remanence<br />
L11<br />
partly supported by the Gravity and Magnetics Research Consortium,<br />
sponsored by Anadarko, BGP, BP, Chevron, ConocoPhillips,<br />
and Vale. Partial funding support was provided by KORES.<br />
REFERENCES<br />
Blakely, R. J., 1996, Potential theory in gravity and <strong>magnetic</strong> applications:<br />
Cambridge University Press.<br />
Dampney, C. N. G., 1969, The equivalent source technique: Geophysics, 34,<br />
38–53.<br />
Dannemiller, N., and Y. Li, 2006, Anew method for estimation <strong>of</strong> magnetization<br />
direction: Geophysics, 71, no. 6, L69–L73.<br />
Dransfield, M., A. Christensen, and G. Liu, 2003, Airborne vec<strong>to</strong>r <strong>magnetic</strong>s<br />
mapping <strong>of</strong> remanently magnetized banded iron formations at Rocklea,<br />
WesternAustralia: Exploration Geophysics, 34, 93–96.<br />
Haney, M., C. Johns<strong>to</strong>n, Y. Li, and M. Nabighian, 2003, Envelopes <strong>of</strong> 2D and<br />
<strong>3D</strong> <strong>magnetic</strong> data and their relationship <strong>to</strong> the analytic signal: Preliminary<br />
results: 73rd Annual International Meeting, SEG, Expanded Abstracts,<br />
596–599.<br />
Haney, M., and Y. Li, 2002, Total magnetization direction and dip from multiscale<br />
edges: 72nd Annual International Meeting, SEG, Expanded Abstracts,<br />
735–738.<br />
Hansen, R. O., and R. S. Pawlowski, 1989, Reduction <strong>to</strong> the pole at low latitude<br />
by Wiener filtering: Geophysics, 54, 1607–1613.<br />
Helbig, K., 1962, Some integrals <strong>of</strong> <strong>magnetic</strong> anomalies and their relationship<br />
<strong>to</strong> the parameters <strong>of</strong> the disturbing body: Zeitschrift für Geophysik,<br />
29, 83–97.<br />
Hornby, P., F. Boschetti, and F. G. Horowitz, 1999, Analysis <strong>of</strong> potential field<br />
data in the wavelet domain: Geophysical Journal International, 137,<br />
175–196.<br />
Lelièvre, P. G., and D. W. Oldenburg, 2009, A <strong>3D</strong> <strong>to</strong>tal magnetization <strong>inversion</strong><br />
applicable when significant, complicated remanence is present: Geophysics,<br />
74, no. 3, L21–L30.<br />
Li, Y., and D. W. Oldenburg, 1996, 3-D <strong>inversion</strong> <strong>of</strong> <strong>magnetic</strong> data: Geophysics,<br />
61, 394–408.<br />
——–, 2001, Stable reduction <strong>to</strong> the pole at the <strong>magnetic</strong> equa<strong>to</strong>r: Geophysics,<br />
66, 571–578.<br />
——–, 2003, Fast <strong>inversion</strong> <strong>of</strong> large-scale <strong>magnetic</strong> data using wavelet transforms<br />
and a logarithmic barrier method: Geophysical Journal International,<br />
152, 251–265.<br />
Lourenco, J. S., and H. F. Morrison, 1973, Vec<strong>to</strong>r <strong>magnetic</strong> anomalies derived<br />
from measurements <strong>of</strong> a single component <strong>of</strong> the field: Geophysics,<br />
38, 359–368.<br />
Mendonca, C. A., and J. B. C. Silva, 1993, A stable truncated series approximation<br />
<strong>of</strong> the reduction-<strong>to</strong>-the-pole opera<strong>to</strong>r: Geophysics, 58, 1084–1090.<br />
Nabighian, M., 1972, The analytic signal <strong>of</strong> two-dimensional <strong>magnetic</strong> bodies<br />
with polygonal cross-section: Its properties and use for au<strong>to</strong>mated<br />
anomaly interpretation: Geophysics, 37, 507–517.<br />
Paine, J., M. Haederle, and M. Flis, 2001, Using transformed TMI data <strong>to</strong> invert<br />
for remanently magnetised bodies: Exploration Geophysics, 32,238–<br />
242.<br />
Pedersen, L. B., 1978, Wavenumber domain expressions for potential fields<br />
from arbitrary 2-, 2 1 2-, and 3-dimensional bodies: Geophysics, 43,<br />
626–630.<br />
Phillips, J. D., 2005, Can we estimate <strong>to</strong>tal magnetization directions from<br />
aero<strong>magnetic</strong> data using Helbig’s formulas: Earth, Planets, and Space, 57,<br />
681–689.<br />
Pilking<strong>to</strong>n, M., 1997, 3-D <strong>magnetic</strong> imaging using conjugate gradients: Geophysics,<br />
62, 1132–1142.<br />
Roest, W., and M. Pilking<strong>to</strong>n, 1993, Identifying remanent magnetization effects<br />
in <strong>magnetic</strong> data: Geophysics, 58, 653–659.<br />
Schmidt, P. W., and D. A. Clark, 1998, The calculation <strong>of</strong> <strong>magnetic</strong> components<br />
and moments from TMI: A case study from the Tuckers igneous<br />
complex, Queensland: Exploration Geophysics, 29, 609–614.<br />
Shearer, S., 2005, Three-dimensional <strong>inversion</strong> <strong>of</strong> <strong>magnetic</strong> data in the presence<br />
<strong>of</strong> remanent magnetization: M.S. thesis, Colorado School <strong>of</strong> Mines.<br />
Shearer, S., and Y. Li., 2004, <strong>3D</strong> Inversion <strong>of</strong> <strong>magnetic</strong> <strong>to</strong>tal-gradient data in<br />
the presence <strong>of</strong> remanent magnetization: 74th Annual International Meeting,<br />
SEG, ExpandedAbstracts, 774–777.<br />
Wright, S. J., 1997, Primal-dual interior-point methods: SIAM.<br />
Zietz, I., and G. E. Andreasen, 1967, Remanent magnetization and aero<strong>magnetic</strong><br />
interpretation: Mining Geophysics, 2, 569–590.