Vertical radar profiling - CGISS - Boise State University
Vertical radar profiling - CGISS - Boise State University
Vertical radar profiling - CGISS - Boise State University

Create successful ePaper yourself
Turn your PDF publications into a flip-book with our unique Google optimized e-Paper software.
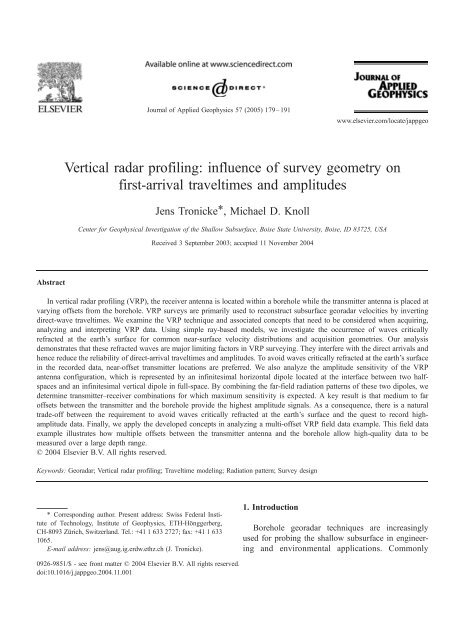
Journal of Applied Geophysics 57 (2005) 179–191<br />
www.elsevier.com/locate/jappgeo<br />
<strong>Vertical</strong> <strong>radar</strong> <strong>profiling</strong>: influence of survey geometry on<br />
first-arrival traveltimes and amplitudes<br />
Jens Tronicke*, Michael D. Knoll<br />
Center for Geophysical Investigation of the Shallow Subsurface, <strong>Boise</strong> <strong>State</strong> <strong>University</strong>, <strong>Boise</strong>, ID 83725, USA<br />
Received 3 September 2003; accepted 11 November 2004<br />
Abstract<br />
In vertical <strong>radar</strong> <strong>profiling</strong> (VRP), the receiver antenna is located within a borehole while the transmitter antenna is placed at<br />
varying offsets from the borehole. VRP surveys are primarily used to reconstruct subsurface geo<strong>radar</strong> velocities by inverting<br />
direct-wave traveltimes. We examine the VRP technique and associated concepts that need to be considered when acquiring,<br />
analyzing and interpreting VRP data. Using simple ray-based models, we investigate the occurrence of waves critically<br />
refracted at the earth’s surface for common near-surface velocity distributions and acquisition geometries. Our analysis<br />
demonstrates that these refracted waves are major limiting factors in VRP surveying. They interfere with the direct arrivals and<br />
hence reduce the reliability of direct-arrival traveltimes and amplitudes. To avoid waves critically refracted at the earth’s surface<br />
in the recorded data, near-offset transmitter locations are preferred. We also analyze the amplitude sensitivity of the VRP<br />
antenna configuration, which is represented by an infinitesimal horizontal dipole located at the interface between two halfspaces<br />
and an infinitesimal vertical dipole in full-space. By combining the far-field radiation patterns of these two dipoles, we<br />
determine transmitter–receiver combinations for which maximum sensitivity is expected. A key result is that medium to far<br />
offsets between the transmitter and the borehole provide the highest amplitude signals. As a consequence, there is a natural<br />
trade-off between the requirement to avoid waves critically refracted at the earth’s surface and the quest to record highamplitude<br />
data. Finally, we apply the developed concepts in analyzing a multi-offset VRP field data example. This field data<br />
example illustrates how multiple offsets between the transmitter antenna and the borehole allow high-quality data to be<br />
measured over a large depth range.<br />
D 2004 Elsevier B.V. All rights reserved.<br />
Keywords: Geo<strong>radar</strong>; <strong>Vertical</strong> <strong>radar</strong> <strong>profiling</strong>; Traveltime modeling; Radiation pattern; Survey design<br />
* Corresponding author. Present address: Swiss Federal Institute<br />
of Technology, Institute of Geophysics, ETH-Hfnggerberg,<br />
CH-8093 Zqrich, Switzerland. Tel.: +41 1 633 2727; fax: +41 1 633<br />
1065.<br />
E-mail address: jens@aug.ig.erdw.ethz.ch (J. Tronicke).<br />
1. Introduction<br />
Borehole geo<strong>radar</strong> techniques are increasingly<br />
used for probing the shallow subsurface in engineering<br />
and environmental applications. Commonly<br />
0926-9851/$ - see front matter D 2004 Elsevier B.V. All rights reserved.<br />
doi:10.1016/j.jappgeo.2004.11.001
180<br />
J. Tronicke, M.D. Knoll / Journal of Applied Geophysics 57 (2005) 179–191<br />
applied techniques include crosshole surveying (e.g.,<br />
Olsson et al., 1992; Binley et al., 2001; Tronicke et<br />
al., 2001) and single-hole reflection surveying (e.g.,<br />
Olsson et al., 1992, Lane et al., 1998; Hollender et<br />
al., 1999). In crosshole surveying, transmitter and<br />
receiver antennas are placed in two different boreholes<br />
and a transmission experiment is performed.<br />
By inverting the arrival times or amplitudes of first<br />
arrivals, an image of electromagnetic wave velocity<br />
or attenuation for the inter-borehole plane is determined.<br />
In single-hole reflection surveying, the two<br />
antennas are located in the same borehole and<br />
reflected arrivals are analyzed using methods developed<br />
for surface-based reflection data.<br />
<strong>Vertical</strong> <strong>radar</strong> <strong>profiling</strong> (VRP) is a rather new<br />
technique in which the receiving antenna is lowered<br />
down a borehole and the transmitting antenna is<br />
placed on the surface at one or more offsets from<br />
the borehole. VRP studies for characterization of<br />
the shallow subsurface have been published for<br />
hydrological (Knoll, 1996; Knoll and Clement,<br />
1999; Tronicke et al., 2000; Buursink et al.,<br />
2002) and archaeological (Lu et al., 1996; Zhou<br />
and Sato, 2000) applications. These studies indicate<br />
that the VRP method is a promising shallow<br />
exploration tool that may replace or complement<br />
surface and crosshole geo<strong>radar</strong> surveying. Electromagnetic<br />
velocity information can be determined<br />
from inversions of the direct arrival times (e.g.,<br />
Knoll and Clement, 1999), and reflected or diffracted<br />
energy can be used to image subsurface<br />
structures (Zhou and Sato, 2000; Witten and Lane,<br />
2003). Furthermore, VRP data can supplement<br />
crosshole geo<strong>radar</strong> data sets by increasing the<br />
effective maximum aperture of the observations<br />
(e.g., Hammon et al., 2002).<br />
VRP surveying is similar to the well-established<br />
vertical seismic <strong>profiling</strong> (VSP) technique (e.g.,<br />
Hardage, 2000). In near-surface applications, VSP<br />
surveys are mainly used to construct subsurface<br />
velocity models and reflection images which can be<br />
used as a complement to surface seismic data (e.g.,<br />
Jarvis and Knight, 2000) or as a link to important<br />
engineering or environmental parameters (e.g.,<br />
Milligan et al., 1997; Moret et al., 2004). However,<br />
there are some significant differences between VRP<br />
and VSP surveys that need to be considered in VRP<br />
data analysis and interpretation. For example, <strong>radar</strong><br />
velocities usually decrease from the surface through<br />
the vadose zone to the water-saturated zone,<br />
whereas seismic velocities generally increase.<br />
Because subsurface velocities affect all wave phenomena,<br />
the pattern of VRP arrivals may be quite<br />
different from the pattern of VSP arrivals recorded<br />
at the same location. Before adapting VSP processing<br />
and interpretation schemes to VRP data, we<br />
need to understand better the nature of electromagnetic<br />
wave propagation for typical VRP survey<br />
geometries.<br />
In surface and downhole geo<strong>radar</strong> surveys, the<br />
antenna radiation patterns strongly influence the<br />
amplitudes of the sampled wave fields. The directivity<br />
of the antennas depends on the electrical properties of<br />
the surrounding media. Numerous studies have been<br />
concerned with the radiation pattern of surface or<br />
downhole dipole antennas (e.g., Engheta et al., 1982;<br />
Sato and Thierbach, 1991; Arcone, 1995; Holliger et<br />
al., 2001; Lampe et al., 2003), but for the acquisition<br />
and interpretation of VRP data, the combination of a<br />
horizontal surface and a vertical downhole dipole<br />
antenna has to be considered. To the best of our<br />
knowledge, there have been no previous investigations<br />
of this antenna configuration and its influence on<br />
the amplitudes of recorded VRP data. The goal of the<br />
present study is to address the following three<br />
questions:<br />
! How do waves critically refracted at the earth’s<br />
surface influence VRP data and their interpretation<br />
! How does the specific VRP antenna configuration<br />
affect the recorded signals<br />
! Is there an optimal acquisition scheme for VRP<br />
data<br />
We begin by investigating the occurrence of<br />
arrivals critically refracted at the ground–air interface.<br />
To examine this issue, we compute the critical<br />
offsets x c from the wellhead for different layered<br />
velocity distributions using a ray-approximation of<br />
electromagnetic wave propagation; that is, for given<br />
transmitting and receiving antenna positions, we<br />
compute the minimum distance from the borehole<br />
at which critical refraction wave propagation first<br />
occurs. For example, identifying and eliminating<br />
traveltimes from arrivals critically refracted at the
J. Tronicke, M.D. Knoll / Journal of Applied Geophysics 57 (2005) 179–191 181<br />
earth’s surface might improve and stabilize results of<br />
first-arrival traveltime inversion using standard inversion<br />
schemes.<br />
We then analyze the amplitude sensitivity of the<br />
VRP antenna configuration and its influence on the<br />
recorded data. To address this issue, we introduce a<br />
simple method for combining surface and downhole<br />
radiation patterns and compare our analytical results<br />
to those predicted by full waveform finite-difference<br />
modeling. The analysis of critically refracted arrivals<br />
and antenna radiation pattern effects allows us<br />
to draw some conclusions about how VRP data<br />
should be acquired and analyzed. Finally, we<br />
illustrate by means of a multi-offset field example<br />
how an understanding of critically refracted waves<br />
and radiation pattern effects can be helpful in<br />
processing and interpreting VRP field data. An<br />
important conclusion of our investigation is that<br />
there is a trade-off between the need to have short<br />
transmitter-borehole offsets to avoid the recording<br />
of critically refracted waves and the desire to have<br />
long transmitter-borehole offsets to avoid nulls in<br />
the radiation patterns. In this way, this paper<br />
investigates the influence of VRP survey geometry<br />
on first-arrival traveltimes and amplitudes, and<br />
serves as a tutorial on how to plan and execute a<br />
multi-offset VRP survey.<br />
2. Identifying direct and critically refracted<br />
arrivals<br />
Fig. 1 illustrates travelpaths and traveltime curves<br />
of major arrivals commonly observed in VRP<br />
experiments. The model in this figure comprises air<br />
with a geo<strong>radar</strong> velocity c (0.3 m/ns) overlying<br />
successively a homogenous isotropic layer with<br />
velocity v 1 and thickness z 1 and a homogeneous<br />
isotropic half-space with velocity v 2 . While the<br />
transmitter antenna is maintained at a fixed horizontal<br />
distance x a from the borehole, the receiver antenna is<br />
lowered down the borehole at progressively increasing<br />
depths z a . After the receiver antenna has been<br />
moved down the length of the borehole, the trans-<br />
Fig. 1. For a fixed surface transmitter: (a) sketch illustrating VRP geometry and major travelpaths, and (b) corresponding traveltime curves. In<br />
(a), a c is the critical angle at the ground–air interface defined by sin a c =v 1 /c, where c and v 1 are <strong>radar</strong>-wave velocities in air and in the shallow<br />
subsurface. v 2 is the <strong>radar</strong>-wave velocity below the subsurface reflecting interface. Both the travelpaths in (a) and the traveltime curves in (b) are<br />
calculated assuming a constant subsurface velocity of 0.l m/ns and a horizontal reflecting interface at 7.0 m depth.
182<br />
J. Tronicke, M.D. Knoll / Journal of Applied Geophysics 57 (2005) 179–191<br />
Fig. 2. Critical offset from borehole as a function of receiver-antenna depth for three suites of three-layer models: (a) air and homogeneous layer<br />
with thickness N18 m and a homogeneous half-space (latter not shown in model sketch); (b) air, 4.0-m-thick layer with variable velocity and a<br />
homogeneous half-space with a 0.075 m/ns constant velocity; (c) air, 4.0-m-thick layer with constant 0.125 m/ns velocity, and a homogeneous<br />
half-space with variable velocity.
J. Tronicke, M.D. Knoll / Journal of Applied Geophysics 57 (2005) 179–191 183<br />
mitter may be moved to a new location and the<br />
process repeated. Using geometrical optics as a highfrequency<br />
approximation of electromagnetic wave<br />
propagation, the traveltimes for the direct wave (t dir ),<br />
reflected wave (t ref ) and waves critically refracted at<br />
the earth’s surface (t cri ) are given by:<br />
pffiffiffiffiffiffiffiffiffiffiffiffiffiffi<br />
x 2 a<br />
t dir ¼<br />
þ z2 a<br />
ð1Þ<br />
t ref ¼<br />
v 1<br />
qffiffiffiffiffiffiffiffiffiffiffiffiffiffiffiffiffiffiffiffiffiffiffiffiffiffiffiffiffiffiffi<br />
x 2 a þð2z 1 z a Þ 2<br />
v 1<br />
ð2Þ<br />
sffiffiffiffiffiffiffiffiffiffiffiffiffiffiffiffi<br />
t cri ¼ x a<br />
c þ z 1 1<br />
a<br />
c 2 : ð3Þ<br />
v 2 1<br />
The downgoing direct wave exhibits positive<br />
moveout (Eq. (1)), such that traveltimes increase as<br />
the recording depth increases, whereas the traveltimes<br />
of the upgoing reflections (Eq. (2)) decrease as the<br />
recording depth increases. In contrast to VSP surveys,<br />
waves critically refracted at the ground–air interface<br />
are often present in VRP data. Traveltimes of these<br />
waves increase linearly with receiver antenna depth<br />
(Eq. (3)). For short transmitter-borehole offsets and<br />
shallow receiver positions, critically refracted waves<br />
may interfere with the direct arrivals. This may<br />
complicate the determination of direct arrival times<br />
which are required for generating reliable subsurface<br />
velocity models. The point x c along the surface from<br />
which the critically refracted wave propagates to a<br />
given depth z a is given by:<br />
<br />
x c ¼ z a d tan<br />
arcsin v 1<br />
c<br />
<br />
; for z a Vz 1 ; ð4Þ<br />
<br />
x c ¼ z 1 d tan arcsin v <br />
1<br />
þðz a<br />
c<br />
z 1 Þd tanðarcsin v 2<br />
c Þ;<br />
for z a Nz 1 :<br />
ð5Þ<br />
Fig. 3. Critical offset from borehole as a function of receiverantenna<br />
and interface depths for a three layer case: c=0.3 m/ns (air),<br />
v 1 =0.125 m/ns and v 2 =0.075 m/ns. The black line separates antenna<br />
positions above the interface from those below.<br />
Fig. 2 shows these critical offsets for three different<br />
suites of three-layer models selected to represent a<br />
wide variety of near-surface conditions. In Fig. 2a, the<br />
depth to the base of the first subsurface layer is<br />
beyond the maximum receiver antenna depth, so it is<br />
effectively a two-layer model. The critical offset<br />
increases uniformly with decreasing velocity contrast<br />
between air and the subsurface medium and with<br />
increasing antenna depth. The situation for a 4-mthick<br />
subsurface layer with different velocities overlying<br />
a homogeneous half-space with fixed velocity is<br />
presented in Fig. 2b. This model includes the case of a<br />
vadose zone overlying a water-saturated zone. Until<br />
the receiver antenna reaches the depth of the interface,<br />
the results are the same as in Fig. 2a. Beyond 4 m<br />
depth, the slope changes significantly as a function of<br />
the velocity contrast between the two subsurface<br />
layers. Fig. 2c is based on a similar model to that of<br />
Fig. 2b, except the velocity of the upper subsurface<br />
layer is fixed and the velocity of the lower one is<br />
varied. Again, at antenna depths below the interface,<br />
the critical offset x c depends significantly on the<br />
contrast in subsurface velocities.<br />
Fig. 3 illustrates x c as a function of receiver<br />
antenna and interface depth assuming a fixed threelayer<br />
velocity model: c=0.3 m/ns, v 1 =0.125 m/ns and<br />
v 2 =0.075 m/ns. The interface depth influences<br />
strongly x c , such that the deeper the interface, the<br />
larger x c is for a given receiver-antenna depth. All
184<br />
J. Tronicke, M.D. Knoll / Journal of Applied Geophysics 57 (2005) 179–191<br />
model results shown in Figs. 2 and 3 demonstrate that<br />
arrivals critically refracted at the earth’s surface are<br />
likely to occur in shallow VRP surveys for borehole<br />
depths around 10 to 20 m. For locations at which<br />
subsurface velocities are approximately known, our<br />
modeling procedure and results allow investigators to<br />
estimate transmitter-borehole offsets that avoid<br />
unwanted critically refracted arrivals. Furthermore,<br />
such plots help to identify critically refracted waves<br />
during data processing and interpretation.<br />
3. Effects of radiation patterns on recorded<br />
amplitudes<br />
Commercially available geo<strong>radar</strong> surface and borehole<br />
antennas are usually half-wave dipole antennas<br />
with strong directional radiation patterns that depend<br />
on the electrical properties of the surrounding media.<br />
Commonly, a surface dipole antenna is approximated<br />
by a horizontal infinitesimal electric dipole located at<br />
the interface between two homogeneous half-spaces,<br />
one representing air with dielectric permittivity e 0 and<br />
one representing the subsurface with dielectric permittivity<br />
e r e 0 , where e r is the relative permittivity of<br />
the medium (Engheta et al., 1982). The associated<br />
dipole patterns depend strongly on the contrast in<br />
dielectric permittivities between the upper and lower<br />
half-spaces. Although recent studies (e.g., Holliger<br />
and Bergmann, 1998; van der Kruk and Slob, 2000;<br />
Lampe et al., 2003) show that the characteristics of<br />
this model may diverge from those of realistic<br />
geo<strong>radar</strong> surface antennas, the infinitesimal dipole<br />
model describes the main directional dependence of<br />
E-field values associated with a dipole antenna<br />
located on the surface. For a dipole antenna located<br />
within an air-filled borehole, Holliger et al. (2001)<br />
find that the radiation pattern of a vertical infinitesimal<br />
dipole in full-space is a valid approximation.<br />
When the borehole contains water, the radiation<br />
pattern is distorted, such that this approximation<br />
may be inadequate (Holliger et al., 2001).<br />
Here, we focus on the angular E-field amplitude<br />
trends that are expected in a VRP survey. Typically, the<br />
dipole axes of the transmitting and receiving antenna<br />
are oriented perpendicular to each other (Fig. 4;<br />
horizontal at the surface and vertical in the borehole).<br />
We only consider the case for which the two dipole<br />
axes are located in the same plane (copolarized<br />
orientation of the antennas). In investigating the<br />
amplitude sensitivity of this antenna configuration,<br />
we apply the often used far-field approximation for the<br />
surface antenna (Engheta et al., 1982) and the fullspace<br />
approximation for the borehole antenna (Holliger<br />
et al., 2001). For a lower medium with dielectric<br />
permittivity of 5e 0 , the radiation patterns of the<br />
surface and borehole dipoles, normalized to their<br />
individual maximum values, are shown in Fig. 5a<br />
and b. Because we consider copolarized antennas,<br />
only the E-plane (vertical plane containing the<br />
antenna elements) of the surface dipole needs to be<br />
considered.<br />
In Fig. 5a, the far-field radiation pattern of the<br />
surface antenna (gray curve) has a three-lobed<br />
structure in the subsurface with distinct nulls at 08,<br />
1808, 2438 and 2978. For comparison, we show on the<br />
same figure the equivalent finite-difference modeled<br />
radiation pattern (black curve) for a finite-length<br />
surface antenna (after Lampe et al., 2003). The<br />
general shape of the numerical radiation pattern is<br />
comparable to the analytical far-field approximation,<br />
except the side lobes are less pronounced and the nulls<br />
are replaced by low sensitivities.<br />
The radiation pattern of the borehole antenna (Fig.<br />
5b) calculated using the far-field approximation of a<br />
vertical dipole in full-space is characterized by a<br />
cosine function with nulls at 908 and 2708. When<br />
comparing Fig. 5a with Fig. 5b, significant differences<br />
Fig. 4. Sketch illustrating antenna layout in a typical VRP<br />
experiment. The horizontal surface dipole antenna is represented<br />
by the horizontal arrow and the vertical borehole dipole by the<br />
vertical arrow.
J. Tronicke, M.D. Knoll / Journal of Applied Geophysics 57 (2005) 179–191 185<br />
in angular sensitivity between the horizontal and<br />
vertical dipoles are clearly visible.<br />
Fig. 5c shows the results of combining the borehole<br />
dipole radiation pattern with the vertical components<br />
of the surface dipole radiation patterns via<br />
simple multiplication. This is common practice for<br />
describing a two-antenna system (Arcone, 1995). The<br />
light gray curve in Fig. 5c represents the result of<br />
multiplying together the two approximations whereas<br />
the black points represent the numerical radiation<br />
pattern extracted from finite-difference modeling by<br />
considering only the z-component of the E-field. The<br />
general shape of the two radiation patterns plotted in<br />
Fig. 5c is quite similar, showing that our simple<br />
analytical model describes the main characteristics of<br />
amplitude sensitivities associated with the copolarized<br />
VRP antenna configuration. We should not, however,<br />
include the sharp nulls (except for that at 2708) and<br />
second-order maxima (e.g., those at ~2408 and ~3008)<br />
in our analysis and interpretation.<br />
Fig. 6 shows combinations of the analytical surface<br />
and borehole dipole radiation patterns for different<br />
subsurface dielectric permittivities. The subsurface<br />
permittivities vary between 1e 0 and 16e 0 , spanning<br />
values typical of many near-surface materials. Since<br />
we are only interested in relative changes, all patterns<br />
are normalized with respect to their individual<br />
maximum value. The plots in Fig. 6 show strong<br />
directivities, with low sensitivities in the directions of<br />
both dipole axes. For subsurface permittivities of 4e 0 ,<br />
9e 0 and 16e 0 , the widths of the main lobes increase<br />
with increasing dielectric permittivity, approaching<br />
the pattern for a subsurface permittivity of 1e 0 (i.e.,<br />
for a homogenous full space). Maximum sensitivities<br />
for all shown models occur at ~2258 and ~3158. The<br />
general shapes of the curves are very similar,<br />
indicating that the influence of the medium beneath<br />
and surrounding the antennas is not as pronounced in<br />
VRP data as it is in surface data.<br />
Both the investigation of arrivals critically<br />
refracted at the earth’s surface and the study of<br />
amplitude sensitivity illustrate the influence of acquisition<br />
geometry on VRP data. We have learned that<br />
critically refracted arrivals are likely to be recorded<br />
and that amplitude sensitivity depends strongly on the<br />
Fig. 5. (a) Far-field approximated (gray) and finite-difference<br />
modeled (black) radiation patterns (in E-plane) for a horizontal<br />
infinitesimal dipole located on a dielectric half-space; (b) Far-field<br />
approximated radiation pattern for a vertical infinitesimal dipole<br />
within a full-space; (c) Far-field approximated (gray) and finitedifference<br />
modeled (black) radiation patterns for a copolarized VRP<br />
antenna configuration (see Fig. 4). In (a) and (b), the dielectric<br />
permittivity of the lower half-space is 5e 0 . Each curve is normalized<br />
to its individual maximum value. For angle definition, see Fig. 4.
186<br />
J. Tronicke, M.D. Knoll / Journal of Applied Geophysics 57 (2005) 179–191<br />
Fig. 6. Influence of subsurface dielectric permittivity on the amplitude sensitivity of the VRP antenna configuration. Radiation patterns are the<br />
result of combining the analytical far-field radiation patterns of an infinitesimal horizontal dipole with that of an infinitesimal vertical dipole.<br />
Different diagrams represent different subsurface dielectric permittivities (values shown above each plot). Each curve is normalized to its<br />
individual maximum value. For angle definition, see Fig. 4.<br />
angle between the surface and the borehole antenna.<br />
In the next section, we demonstrate how these issues<br />
manifest themselves in field data.<br />
4. Field data example<br />
In 1998, a multi-offset VRP data set was recorded<br />
in well A1 at the <strong>Boise</strong> Hydrogeophysical Research<br />
Site (BHRS). The BHRS is a research wellfield<br />
located on a gravel bar of the <strong>Boise</strong> River where<br />
much is known about the subsurface distribution of<br />
hydrologic and geophysical properties (Barrash and<br />
Knoll, 1998; Barrash et al., 1999; Knoll and<br />
Clement, 1999; Peretti et al., 1999; Peterson et al.,<br />
1999; Barrash and Clemo, 2002). Well A1 penetrates<br />
~20 m of coarse alluvial sediments that have been<br />
subdivided into five units with varying amounts of<br />
cobble and sand and different porosity geostatistics<br />
(Barrash and Clemo, 2002). The groundwater table<br />
during the experiments was located 2.55 m below<br />
land surface.<br />
A commercial geo<strong>radar</strong> system (Mala RAMAC/<br />
GPR) with 250-MHz borehole antennas was used to<br />
acquire the VRP data. The antennas were resistively<br />
loaded electric-field dipoles with integral batteries and<br />
transmitter and receiver electronics. Fiber-optic cables<br />
were used to transfer timing information and digital<br />
data between the antennas and the <strong>radar</strong> control unit.<br />
The receiver station spacing in each transmitter gather<br />
was 0.05 m. In total, six common-transmitter gathers<br />
were recorded over a 1.0–6.0 m transmitter-borehole<br />
offset range (step size 1.0 m along the surface).<br />
Fig. 7 shows two common-transmitter gathers<br />
recorded while the transmitter was positioned 3.0<br />
and 6.0 m from the borehole. The only processing<br />
applied to these gathers is zero-time correction, DC<br />
shift removal and application of the same depthdependent<br />
scaling function that preserves relative<br />
amplitude information. On both gathers, the slope of<br />
the first arrivals shows a significant change at ~2.5 m<br />
depth and minor fluctuations at deeper levels. This<br />
change in slope is related to the 2.55-m groundwater<br />
table depth. Some secondary arrivals are clearly<br />
visible (e.g., above the groundwater table between<br />
~40 and ~80 ns). For receiver positions above 2.5 m,<br />
interference of different events, including the direct<br />
arrivals, complicates their identification. To identify<br />
the complicated interfering events in the vadose zone<br />
and the direct-traveling energy in the saturated zone, a
J. Tronicke, M.D. Knoll / Journal of Applied Geophysics 57 (2005) 179–191 187<br />
Fig. 7. Two common transmitter gathers of the BHRS data set recorded at different borehole offsets. The two gathers are displayed with the<br />
same depth-scaled gain. Overlain curves show arrival times for the critically refracted waves (dashed red curves) and for the direct waves (solid<br />
yellow curves) calculated using a simplified model consisting of air (c=0.3 m/ns), a 2.55-m-thick homogenous layer (v 1 =0.14 m/ns) and a<br />
homogenous half-space (v 2 =0.09 m/ns).<br />
more detailed analysis based on the concepts developed<br />
above is necessary.<br />
As a first approximation, the <strong>radar</strong> stratigraphy at<br />
the BHRS can be modeled as a horizontally layered<br />
earth consisting of three layers (air, unsaturated<br />
sediments and saturated sediments). To ensure accurate<br />
and independent estimates of subsurface geo<strong>radar</strong><br />
velocities for further analysis, we use information<br />
extracted from complementary surface and crosshole<br />
geo<strong>radar</strong> data recorded at the BHRS (Peretti et al.,<br />
1999; Peterson et al., 1999; Tronicke et al., 2004). The<br />
ground wave observed in a nearby CMP data set<br />
yields a velocity of 0.14 m/ns for the upper part of the<br />
vadose zone. Analysis of crosswell tomographic data<br />
yields an average velocity of 0.09 m/ns for the<br />
saturated zone. By using this simple velocity model,<br />
we can estimate the arrival times of direct waves and<br />
waves critically refracted at the earth’s surface using a<br />
ray-tracing algorithm and Eqs. (4) and (5) (red and<br />
yellow lines in Fig. 7). For the 3.0-m offset gather in<br />
Fig. 7, critically refracted waves should be present<br />
down to receiver depths of ~7.8 m, and for the 6.0-m<br />
offset gather, critically refracted waves should be<br />
present for all receiver positions. In neither transmitter<br />
gather are the critically refracted and direct arrivals<br />
clearly separable, because their traveltimes are so<br />
similar and the finite length of the wavelets further<br />
complicates the analysis.<br />
We now analyze amplitude variations as functions<br />
of transmitter offset and receiver depth. We analyze<br />
the data without applying any kind of manipulation<br />
because we are interested in the influence of survey<br />
geometry on signal-to-noise ratios and want to insure<br />
that results are not biased by spherical divergence and/<br />
or attenuation compensations. To insure that any<br />
residual DC bias does not contaminate the results,<br />
we pick peak-to-peak amplitudes of the first arriving<br />
wavelet. In Fig. 8a, picked amplitudes for all six<br />
transmitter gathers are plotted as functions of receiver<br />
depth. The overall shapes of the curves are similar for<br />
all offsets. In the vadose zone above 2.55 m, strong<br />
variations are observed, whereas in the saturated zone,<br />
all curves show steadily decreasing amplitudes with<br />
only minor variations. Although the relatively minor<br />
fluctuations are comparable at different offsets (e.g., at<br />
receiver depths of ~10 m, five of the six curves show<br />
relative minima followed by slight increases in<br />
amplitude), there are significant differences in the
188<br />
J. Tronicke, M.D. Knoll / Journal of Applied Geophysics 57 (2005) 179–191<br />
absolute values of the amplitudes (note the log scale<br />
of Fig. 8). Because of rapidly decreasing signal<br />
strength, amplitudes in the nearest offset gathers<br />
(transmitter-borehole offsets of 1.0 and 2.0 m) could<br />
only be picked down to receiver depths of ~10 and<br />
~12 m, respectively. In contrast, strong signals in the<br />
gathers recorded at longer offsets allowed amplitudes<br />
to be picked down to depths of ~14 to ~16 m.<br />
Other trends are visible in the amplitude plots. In<br />
particular, the decay of amplitude with receiver depth<br />
varies with transmitter offset; at shallow receiver<br />
positions (e.g., 3–4 m), the highest amplitudes are<br />
observed at the near-offset transmitter gathers,<br />
whereas at deeper receiver positions (e.g., 9–10 m),<br />
the opposite is seen. These amplitude variations are<br />
qualitatively consistent with our radiation-pattern<br />
analysis. For short transmitter-borehole offsets, the<br />
direct ray paths become steeper as the receiver depth<br />
increases, gradually approaching the vertical (around<br />
2708 in Figs. 5 and 6). Consequently, relatively long<br />
transmitter-borehole offsets would appear to be<br />
desirable. In contrast to this argument, we know that<br />
far-offset gathers are more contaminated with critically<br />
refracted waves than near-offset ones (i.e.,<br />
increasing the offset increases the range of receiver<br />
depths over which critically refracted waves are<br />
recorded). Both of these effects (the occurrence of<br />
critically refracted waves and large amplitude variations<br />
that result from the radiation patterns of dipole<br />
antennas) have to be considered when estimating<br />
intrinsic attenuation.<br />
Using the simple three-layer velocity model<br />
given above, and Eqs. (4) and (5), we have<br />
identified and then excluded from analysis those<br />
transmitter–receiver pairs that are likely to have waves<br />
critically refracted at the earth’s surface as the first<br />
arrivals (Fig. 8b). This procedure results in the<br />
elimination of large amounts of data (e.g., the entire<br />
Fig. 8. First cycle amplitudes as a function of receiver depth for all measured transmitter offsets. In (a), all picked data are shown, whereas in (b),<br />
data are only plotted for depths where no critically refracted arrivals are expected. The thick solid lines at a depth of 2.55 m represent<br />
groundwater table depth. For details, see text.
J. Tronicke, M.D. Knoll / Journal of Applied Geophysics 57 (2005) 179–191 189<br />
transmitter gathers recorded at the two largest offsets).<br />
Fortunately, the three near-offset transmitter gathers<br />
provide complementary information at depths of 2–16<br />
m, thus ensuring optimal data quality over all depth<br />
ranges.<br />
A companion analysis of the traveltime data is<br />
carried out to illustrate the effect that arrivals<br />
critically refracted at earth’s surface can have on<br />
velocity models generated using VRP traveltime data;<br />
that is, we invert the multi-offset VRP traveltime data<br />
with and without suspected critical refractions and<br />
compare the results. The traveltime data with<br />
critically refracted first arrivals correspond to the<br />
data in Fig. 8a, and the data without critically<br />
refracted arrivals correspond to the edited data in<br />
Fig. 8b. For inversion, we used a standard 1-D<br />
iterative inversion scheme which uses curved rays<br />
(Maurer et al., 1999) and parameterized the subsurface<br />
into two homogeneous velocity layers, representing<br />
the vadose zone and the saturated zone,<br />
respectively. The boundary between these two zones<br />
is located at 2.55 m depth to reflect the depth of the<br />
water table at the time of the VRP survey.<br />
The results of the two traveltime inversions are<br />
shown in Fig. 9. Using the entire traveltime data<br />
set (with critically refracted arrivals), the velocities<br />
of the vadose zone and saturated zone are 0.16 and<br />
0.087 m/ns, respectively. For the edited data set,<br />
these velocities are 0.133 and 0.092 m/ns which are<br />
much closer to the values obtained from analysis of<br />
CMP and crosswell geo<strong>radar</strong> data from the site. In<br />
addition, the root-mean-square (RMS) residual<br />
which characterizes the goodness of fit of the<br />
predicted traveltime data illustrates the benefit of<br />
using the edited data set. Removing the suspected<br />
critically refracted first arrivals from the traveltime<br />
data results in a threefold decrease in the RMS<br />
residual and a concomitant increase in the reliability<br />
and accuracy of the corresponding velocity<br />
model.<br />
5. Concluding discussion<br />
Using a simple ray-based model, we have shown<br />
for a variety of commonly observed velocity<br />
distributions that unwanted waves critically refracted<br />
at the earth’s surface may significantly influence<br />
Fig. 9. Inverted two-layer velocity model using the entire traveltime<br />
data set (RMS residual 2.76 ns) compared to one using the data set<br />
in which potential critically refracted arrivals are eliminated in<br />
analogy to Fig. 8b (edited data set, RMS residual 0.84 ns).<br />
VRP data. Their presence reduces the reliability of<br />
direct-arrival traveltimes and amplitudes, limiting the<br />
accuracy of derived subsurface velocity and attenuation<br />
models. We suggest that the identification of<br />
these critically refracted arrivals is a key requirement<br />
in VRP data acquisition, processing and<br />
interpretation.<br />
Another important factor is the angular sensitivity<br />
of the antenna radiation patterns. We developed a<br />
simple analytical model by combining the far-field<br />
radiation pattern of a horizontal dipole located on the<br />
top of a half-space with the radiation pattern of a<br />
vertical dipole situated within a full-space. For<br />
different subsurface dielectric permittivities, our<br />
approximate model shows minimum amplitudes in<br />
the directions of both dipole axes and maximum<br />
values in directions oriented ~458 relative to these<br />
axes. Comparison of the far-field and finite-difference<br />
modeled radiation patterns demonstrates that<br />
the sharp minima in the former are regions of lower<br />
amplitude in the latter. As a result, the critical-angle
190<br />
J. Tronicke, M.D. Knoll / Journal of Applied Geophysics 57 (2005) 179–191<br />
minima and second-order maxima are not as<br />
pronounced as shown in our model. Nevertheless,<br />
because the general shapes of the radiation patterns<br />
are well represented by the analytical far-field<br />
approximation, our simple model allows us to<br />
investigate the general angular amplitude sensitivity<br />
associated with typical VRP antenna configurations.<br />
Understanding this angular dependency helps to<br />
optimize VRP survey design needed for specific<br />
applications, such as direct arrival traveltime inversion<br />
or reflection imaging.<br />
To avoid recording critically refracted waves<br />
requires relatively short transmitter-borehole offsets.<br />
Yet, the general amplitude sensitivity of the VRP<br />
antenna configuration suggests that near-vertical ray<br />
paths should be avoided, because of the low sensitivity<br />
of the vertical receiver dipole at such angles<br />
resulting in lower signal-to-noise ratios for the<br />
corresponding data. This requires that the transmitter-borehole<br />
offset be relatively large. As a<br />
consequence, for a single-offset VRP experiment, a<br />
compromise has to be found between suppressing<br />
critically refracted waves (near-offset transmitter<br />
locations preferred) and recording data with sufficiently<br />
high signal-to-noise ratios (medium- to faroffset<br />
transmitter locations preferred). Depending on<br />
the specific site conditions, the signal-to-noise ratios<br />
at large offsets may also be negatively influenced by<br />
intrinsic attenuation.<br />
Our analysis of a multi-offset VRP field data set<br />
illustrated the need to understand the characteristics<br />
of the first arriving energy. Having access to data<br />
recorded with multiple transmitter-borehole offsets<br />
proved to be extremely useful for extracting highquality<br />
data over a large depth range. As a result<br />
of our synthetic and field studies, we recommend<br />
that VRP data be collected using multiple transmitter-borehole<br />
offsets to ensure maximum data<br />
quality.<br />
Acknowledgements<br />
The first author acknowledges financial support by<br />
the German Science Foundation (DFG) sponsoring a<br />
research fellowship at <strong>CGISS</strong>, <strong>Boise</strong> <strong>State</strong> <strong>University</strong>,<br />
Idaho, where most of the presented work has been<br />
carried out. The second author acknowledges funding<br />
from the Army Research Office, Grant DAAG55-98-<br />
1-0277. We thank Albane Saintenoy for help acquiring<br />
the multi-offset VRP data from the BHRS,<br />
Bernhard Lampe for carrying out the finite-difference<br />
modeling of the radiation patterns and Alan G. Green<br />
for fruitful comments and suggestions. Comments by<br />
Editor-in-chief James W. Rector and two anonymous<br />
journal reviewers greatly improved the quality of this<br />
manuscript.<br />
References<br />
Arcone, S.A., 1995. Numerical studies of the radiation patterns of<br />
resistively loaded dipoles. J. Appl. Geophys. 33 (1–3), 39–52.<br />
Barrash, W., Clemo, T., 2002. Hierarchical geostatistics and<br />
multifacies systems: <strong>Boise</strong> Hydrogeophysical Research Site,<br />
<strong>Boise</strong>, Idaho. Water Resour. Res. 38, 1196.<br />
Barrash, W., Knoll, M.D., 1998. Design of research wellfield for<br />
calibrating geophysical methods against hydrologic parameters.<br />
Proceedings of the 1998 Conference on Hazardous Waste<br />
Research, May 18–21, 1998, Snowbird, UT, Great Plains/Rocky<br />
Mountains Hazardous Substance Research Center, Kansas <strong>State</strong><br />
<strong>University</strong>, pp. 296–318.<br />
Barrash, W., Clemo, T., Knoll, M.D., 1999. <strong>Boise</strong> Hydrogeophysical<br />
Research Site (BHRS): objectives, design, initial geostatistical<br />
results. Proceedings, Symposium on the Application<br />
of Geophysics to Engineering and Environmental Problems, 14–<br />
18 March 1999, Oakland, California. Engineering and Environmental<br />
Geophysical Society, pp. 389–398.<br />
Binley, A., Winship, P., Middleton, R., Pokar, M., West, J., 2001.<br />
High-resolution characterization of vadose zone dynamics using<br />
cross-borehole <strong>radar</strong>. Water Resour. Res. 37, 2639–2652.<br />
Buursink, M.L., Lane, J.W., Clement, W.P., Knoll, M.D., 2002. Use<br />
of vertical-<strong>radar</strong> <strong>profiling</strong> to estimate porosity at two New<br />
England sites and comparison to neutron log porosity. Proceedings,<br />
Symposium on the Application of Geophysics to Engineering<br />
and Environmental Problems, 10–14 February 2002, Las<br />
Vegas, Nevada. Engineering and Environmental Geophysical<br />
Society. 15 pp.<br />
Engheta, N., Papas, C.H., Elachi, C., 1982. Radiation patterns of<br />
interfacial dipole antennas. Radio Sci. 17, 1557–1566.<br />
Hammon III, W.S., Zeng, X., Corbeanu, R.M., McMechan, G.A.,<br />
2002. Estimation of the spatial distribution of fluid permeability<br />
from surface and tomographic GPR data and core, with a 2-D<br />
example from the Ferron Sandstone, Utah. Geophysics 67,<br />
1505–1515.<br />
Hardage, B.A., 2000. <strong>Vertical</strong> Seismic Profiling, Principles.<br />
Handbook of Geophysical Exploration, Seismic Exploration.<br />
Pergamon. 552 pp.<br />
Hollender, F., Tillard, S., Corin, L., 1999. Multifold borehole <strong>radar</strong><br />
acquisition and processing. Geophys. Prospect. 47, 1077–1090.<br />
Holliger, K., Bergmann, T., 1998. Accurate and efficient FDTD<br />
modeling of ground-penetrating <strong>radar</strong> antenna radiation.<br />
Geophys. Res. Lett. 25, 3883–3886.
J. Tronicke, M.D. Knoll / Journal of Applied Geophysics 57 (2005) 179–191 191<br />
Holliger, K., Musil, M., Maurer, H.R., 2001. Ray-based amplitude<br />
tomography for crosshole geo<strong>radar</strong> data: a numerical assessment.<br />
J. Appl. Geophys. 47, 285–298.<br />
Jarvis, K.D., Knight, R., 2000. Near-surface VSP surveys using the<br />
seismic cone penetrometer. Geophysics 65, 1048–1056.<br />
Knoll, M.D., 1996.A petrophysical basis for ground penetrating<br />
<strong>radar</strong> and very early time electromagnetics: electrical properties<br />
of sand–clay mixtures. PhD dissertation, <strong>University</strong> of British<br />
Columbia, Vancouver, Canada, 318 pp.<br />
Knoll, M.D., Clement, W.P., 1999. <strong>Vertical</strong> <strong>radar</strong> <strong>profiling</strong> to<br />
determine dielectric constant, water content and porosity values<br />
at well locations. Proceedings, Symposium on the Application<br />
of Geophysics to Engineering and Environmental Problems,<br />
14–18 March 1999, Oakland, California. Engineering and<br />
Environmental Geophysical Society, pp. 821–830.<br />
Lampe, B., Holliger, K., Green, A.G., 2003. A finite-difference<br />
time-domain simulation tool for ground-penetrating <strong>radar</strong><br />
antennas. Geophysics 68, 971–987.<br />
Lane, J.W., Haeni, F.P., Versteeg, R., 1998. Use of a multi-offset<br />
borehole-<strong>radar</strong> reflection method in fractured crystalline bedrock<br />
at Mirror Lake, Grafton County, New Hampshire.<br />
Proceedings, Symposium on the Application of Geophysics to<br />
Engineering and Environmental Problems, 22–26 March 1998,<br />
Chicago, IL. Engineering and Environmental Geophysical<br />
Society, pp. 359–368.<br />
Lu, Y., Sato, M., Hiroaki, N., 1996. Application of GPR in<br />
archaeology using boreholes. 6th International Conference on<br />
Ground Penetrating Radar: Sendai, Japan, pp. 499–504.<br />
Maurer, H.R., Van der Veen, M., Giudici, J., Springman, S., 1999.<br />
Determining elastic soil properties at small strains. Proceedings,<br />
Symposium on the Application of Geophysics to Engineering<br />
and Environmental Problems, 14–18 March 1998, Oakland, CA,<br />
pp. 417–424.<br />
Milligan, P.A., Rector, J.W., Bainer, R.W., 1997. Hydrophone VSP<br />
imaging at a shallow site. Geophysics 62, 842–852.<br />
Moret, G.J.M., Clement, W.P., Knoll, M.D., Barrash, W., 2004.<br />
VSP traveltime inversion: near-surface issues. Geophysics 69,<br />
345–351.<br />
Olsson, O., Falk, L., Forslund, O., Lundmark, L., Sandberg, E.,<br />
1992. Borehole <strong>radar</strong> applied to the characterization of hydraulically<br />
conductive fracture zones in crystalline rock. Geophys.<br />
Prospect. 40, 109–142.<br />
Peretti, W.R., Knoll, M.D., Clement, W.P., Barrash, W., 1999. 3-D<br />
GPR imaging of complex fluvial stratigraphy at the <strong>Boise</strong><br />
Hydrogeophysical Research Site. Proceedings, Symposium on<br />
the Application of Geophysics to Engineering and Environmental<br />
Problems, 14–18 March 1999, Oakland, CA. Engineering<br />
and Environmental Geophysical Society, pp. 555–564.<br />
Peterson, J.E., Majer, E., Knoll, M.D., 1999. Hydrogeological<br />
property estimation using tomographic data at the <strong>Boise</strong><br />
Hydrogeophysical Research Site. Proceedings, Symposium on<br />
the Application of Geophysics to Engineering and Environmental<br />
Problems, 14–18 March 1999, Oakland, CA. Engineering<br />
and Environmental Geophysical Society, pp. 629–638.<br />
Sato, M., Thierbach, R., 1991. Analysis of a borehole <strong>radar</strong> in crosshole<br />
mode. IEEE Trans. Geosci. Remote Sens. 29, 899–904.<br />
Tronicke, J., Dietrich, P., Appel, E., 2000. Geo<strong>radar</strong> velocity<br />
determination: a comparison of different techniques. Proceedings,<br />
Sixth Meeting of EEGS-ES: Bochum, Germany, GR01,<br />
4 pp.<br />
Tronicke, J., Tweeton, D.R., Dietrich, P., Appel, E., 2001. Improved<br />
crosshole <strong>radar</strong> tomography by using direct and reflected arrival<br />
times. J. Appl. Geophys. 47, 97–105.<br />
Tronicke, J., Holliger, K., Barrash, W., Knoll, M.D., 2004.<br />
Multivariate analysis of cross-hole geo<strong>radar</strong> velocity and<br />
attenuation tomograms for aquifer zonation. Water Resour.<br />
Res. 40, W01519, doi:10.1029/2003WR002031.<br />
van der Kruk, J., Slob, E.C., 2000. The influence of the soil on<br />
reflections from above surface objects in GPR data. Proceedings,<br />
Eighth International Conference On Ground Penetrating<br />
Radar, Queensland, Australia, pp. 453–457.<br />
Witten, A., Lane, J., 2003. Offset vertical <strong>radar</strong> <strong>profiling</strong>. Lead.<br />
Edge Explor. 22, 1070–1076.<br />
Zhou, H., Sato, M., 2000. Application of vertical <strong>radar</strong> <strong>profiling</strong><br />
technique to Sendai Castle. Geophysics 65, 533–539.