- Page 1 and 2:
The Size, Structure, and Variabilit
- Page 3 and 4:
1 Abstract The Size, Structure, and
- Page 5 and 6:
iv 5 Spectroscopy and ISI Measureme
- Page 7 and 8:
vi 3.15 Density, Temperature, and C
- Page 9 and 10:
viii Acknowledgements Over the cour
- Page 11 and 12:
2 to achieve resolution characteris
- Page 13 and 14:
4 sources are not coaligned perfect
- Page 15 and 16:
6 Intensity Profile Hankel Transfor
- Page 17 and 18:
8 Figure 1.3: Possible Effective Ba
- Page 19 and 20:
10 6LJQDO'HWHFWRU 6LJQDO'HWHFWRU /D
- Page 21 and 22:
1995A&A...304...69P 12 Figure 1.5:
- Page 23 and 24:
Figure 1.6: Stellar Evolution of a
- Page 25 and 26:
16 such as Mira variables, become u
- Page 27 and 28:
18 wavelengths, however, its range
- Page 29 and 30:
20 Figure 2.1: ISI Data for o Cet f
- Page 31 and 32:
22 Figure 2.3: Uniform Disk, Limb D
- Page 33 and 34:
24 2.2 Comparison of ISI Data with
- Page 35 and 36:
26 Table 2.3: Diameter Measurements
- Page 37 and 38:
28 measurements. χ Cyg and R Leo a
- Page 39 and 40:
30 metric flux (from the reference
- Page 41 and 42:
32 their surface. Very often, mater
- Page 43 and 44:
34 Mira. Finally, variations in tim
- Page 45 and 46:
36
- Page 47 and 48:
38 Figure 3.2: Intensity Distributi
- Page 49 and 50:
40 Figure 3.4: Ratio of the Best-Fi
- Page 51 and 52:
Figure 3.5: Synthetic Near-Infrared
- Page 53 and 54: 44 Angular Diameter (mas) 60 50 40
- Page 55 and 56: 46 wavelengths which would cause th
- Page 57 and 58: 48 3.4.1 Static Radiative Transfer
- Page 59 and 60: 50 Figure 3.8: Ratio of Photospheri
- Page 61 and 62: 52 3.4.2 The Effect of Dynamic Phen
- Page 63 and 64: 54 Figure 3.10: “Standard” Bowe
- Page 65 and 66: 56 extension is reflected at wavele
- Page 67 and 68: 58 photosphere. These results suppo
- Page 69 and 70: 60 Figure 3.13: Continuum Opacity o
- Page 71 and 72: 62 assuming only continuum sources.
- Page 73 and 74: 64 Figure 3.16: Normalized Syntheti
- Page 75 and 76: Figure 3.17: Density and Temperatur
- Page 77 and 78: 68 Figure 3.19: Apparent Size of H
- Page 79 and 80: 70 of Fox and Wood (1985) [31] are
- Page 81 and 82: 72 3.5 Explanation of Variations in
- Page 83 and 84: 74 Figure 3.21: 2.1 µm Image of 25
- Page 85 and 86: 76 at visible wavelengths either by
- Page 87 and 88: 78 4.1 Implications of Diameter Mea
- Page 89 and 90: 80 11 µm Diameter of o Cet vs. Dat
- Page 91 and 92: 82 Figure 4.3: A uniform intensity
- Page 93 and 94: 84 phase observed in the continuum
- Page 95 and 96: 86 5.1 General Results of 11 µm Sp
- Page 97 and 98: 88 depth are the contours plotted a
- Page 99 and 100: 90 Figure 5.3: Best Fitting Calcula
- Page 101 and 102: 92 of its three parameters. The con
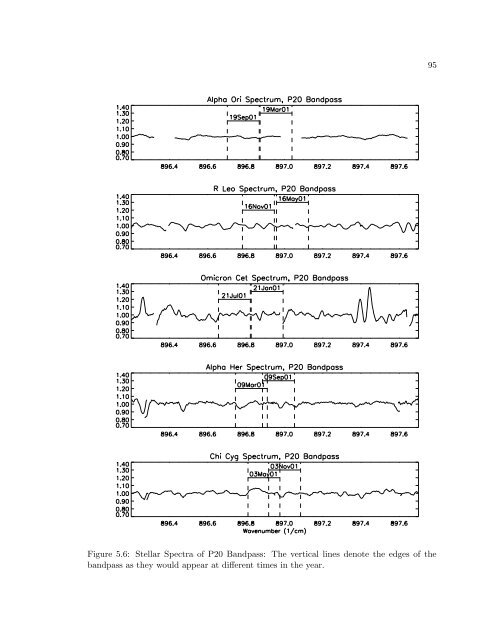
- Page 103: 94 H 2 O on their measured diameter
- Page 107 and 108: 98 Figure 5.7: Stellar Intensity Pr
- Page 109 and 110: Figure 5.9: Observed H 2 O Spectral
- Page 111 and 112: Figure 5.10: Höfner Model Predicte
- Page 113 and 114: 104 30 km/s causes the spectrum to
- Page 115 and 116: Figure 5.13: o Cet Spectra in Obser
- Page 117 and 118: 108 density prediction matches the
- Page 119 and 120: 110 Dixon. The infrared angular dia
- Page 121 and 122: 112 [29] M. U. Feuchtinger, E. A. D
- Page 123 and 124: 114 [50] A. P. Jacob, T. R. Bedding
- Page 125 and 126: 116 [70] A. A. Michelson and F. G.
- Page 127 and 128: 118 [92] Martin Schwarzschild. Over
- Page 129: 120 [114] P. Woitke, D. Krüger, an


![Problem #1 [Structure Formation I: Radiation Era]](https://img.yumpu.com/37147371/1/190x245/problem-1-structure-formation-i-radiation-era.jpg?quality=85)


