The Size, Structure, and Variability of Late-Type Stars Measured ...
The Size, Structure, and Variability of Late-Type Stars Measured ...
The Size, Structure, and Variability of Late-Type Stars Measured ...
You also want an ePaper? Increase the reach of your titles
YUMPU automatically turns print PDFs into web optimized ePapers that Google loves.
4<br />
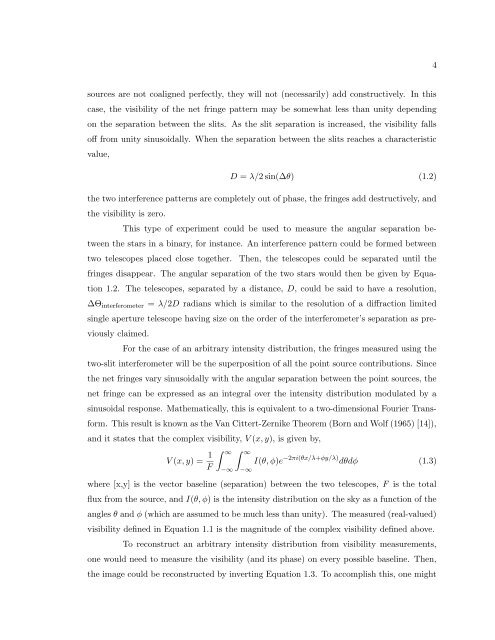
sources are not coaligned perfectly, they will not (necessarily) add constructively. In this<br />
case, the visibility <strong>of</strong> the net fringe pattern may be somewhat less than unity depending<br />
on the separation between the slits. As the slit separation is increased, the visibility falls<br />
<strong>of</strong>f from unity sinusoidally. When the separation between the slits reaches a characteristic<br />
value,<br />
D = λ/2 sin(∆θ) (1.2)<br />
the two interference patterns are completely out <strong>of</strong> phase, the fringes add destructively, <strong>and</strong><br />
the visibility is zero.<br />
This type <strong>of</strong> experiment could be used to measure the angular separation between<br />
the stars in a binary, for instance. An interference pattern could be formed between<br />
two telescopes placed close together. <strong>The</strong>n, the telescopes could be separated until the<br />
fringes disappear. <strong>The</strong> angular separation <strong>of</strong> the two stars would then be given by Equation<br />
1.2. <strong>The</strong> telescopes, separated by a distance, D, could be said to have a resolution,<br />
∆Θ interferometer = λ/2D radians which is similar to the resolution <strong>of</strong> a diffraction limited<br />
single aperture telescope having size on the order <strong>of</strong> the interferometer’s separation as previously<br />
claimed.<br />
For the case <strong>of</strong> an arbitrary intensity distribution, the fringes measured using the<br />
two-slit interferometer will be the superposition <strong>of</strong> all the point source contributions. Since<br />
the net fringes vary sinusoidally with the angular separation between the point sources, the<br />
net fringe can be expressed as an integral over the intensity distribution modulated by a<br />
sinusoidal response. Mathematically, this is equivalent to a two-dimensional Fourier Transform.<br />
This result is known as the Van Cittert-Zernike <strong>The</strong>orem (Born <strong>and</strong> Wolf (1965) [14]),<br />
<strong>and</strong> it states that the complex visibility, V (x, y), is given by,<br />
V (x, y) = 1 F<br />
∫ ∞ ∫ ∞<br />
−∞<br />
−∞<br />
I(θ, φ)e −2πi(θx/λ+φy/λ) dθdφ (1.3)<br />
where [x,y] is the vector baseline (separation) between the two telescopes, F is the total<br />
flux from the source, <strong>and</strong> I(θ, φ) is the intensity distribution on the sky as a function <strong>of</strong> the<br />
angles θ <strong>and</strong> φ (which are assumed to be much less than unity). <strong>The</strong> measured (real-valued)<br />
visibility defined in Equation 1.1 is the magnitude <strong>of</strong> the complex visibility defined above.<br />
To reconstruct an arbitrary intensity distribution from visibility measurements,<br />
one would need to measure the visibility (<strong>and</strong> its phase) on every possible baseline. <strong>The</strong>n,<br />
the image could be reconstructed by inverting Equation 1.3. To accomplish this, one might






![Problem #1 [Structure Formation I: Radiation Era]](https://img.yumpu.com/37147371/1/190x245/problem-1-structure-formation-i-radiation-era.jpg?quality=85)
