The Size, Structure, and Variability of Late-Type Stars Measured ...
The Size, Structure, and Variability of Late-Type Stars Measured ...
The Size, Structure, and Variability of Late-Type Stars Measured ...
You also want an ePaper? Increase the reach of your titles
YUMPU automatically turns print PDFs into web optimized ePapers that Google loves.
19<br />
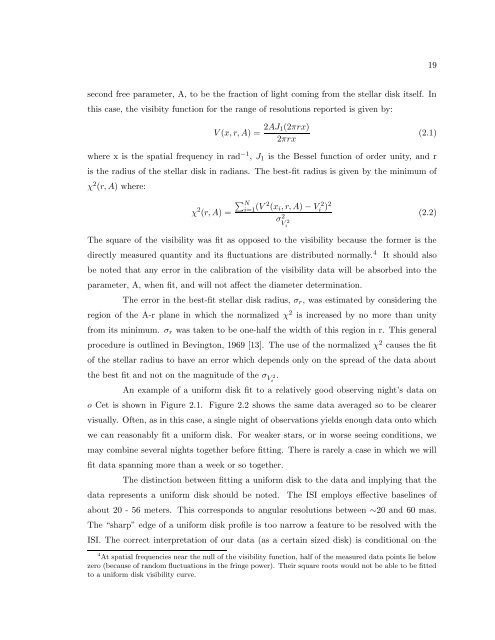
second free parameter, A, to be the fraction <strong>of</strong> light coming from the stellar disk itself. In<br />
this case, the visibity function for the range <strong>of</strong> resolutions reported is given by:<br />
V (x, r, A) = 2AJ 1(2πrx)<br />
2πrx<br />
(2.1)<br />
where x is the spatial frequency in rad −1 , J 1 is the Bessel function <strong>of</strong> order unity, <strong>and</strong> r<br />
is the radius <strong>of</strong> the stellar disk in radians. <strong>The</strong> best-fit radius is given by the minimum <strong>of</strong><br />
χ 2 (r, A) where:<br />
χ 2 (r, A) =<br />
∑ N<br />
i=1 (V 2 (x i , r, A) − V 2<br />
i )2<br />
σ 2 V 2<br />
i<br />
(2.2)<br />
<strong>The</strong> square <strong>of</strong> the visibility was fit as opposed to the visibility because the former is the<br />
directly measured quantity <strong>and</strong> its fluctuations are distributed normally. 4<br />
It should also<br />
be noted that any error in the calibration <strong>of</strong> the visibility data will be absorbed into the<br />
parameter, A, when fit, <strong>and</strong> will not affect the diameter determination.<br />
<strong>The</strong> error in the best-fit stellar disk radius, σ r , was estimated by considering the<br />
region <strong>of</strong> the A-r plane in which the normalized χ 2 is increased by no more than unity<br />
from its minimum. σ r was taken to be one-half the width <strong>of</strong> this region in r. This general<br />
procedure is outlined in Bevington, 1969 [13]. <strong>The</strong> use <strong>of</strong> the normalized χ 2 causes the fit<br />
<strong>of</strong> the stellar radius to have an error which depends only on the spread <strong>of</strong> the data about<br />
the best fit <strong>and</strong> not on the magnitude <strong>of</strong> the σ V 2<br />
i<br />
.<br />
An example <strong>of</strong> a uniform disk fit to a relatively good observing night’s data on<br />
o Cet is shown in Figure 2.1. Figure 2.2 shows the same data averaged so to be clearer<br />
visually. Often, as in this case, a single night <strong>of</strong> observations yields enough data onto which<br />
we can reasonably fit a uniform disk. For weaker stars, or in worse seeing conditions, we<br />
may combine several nights together before fitting. <strong>The</strong>re is rarely a case in which we will<br />
fit data spanning more than a week or so together.<br />
<strong>The</strong> distinction between fitting a uniform disk to the data <strong>and</strong> implying that the<br />
data represents a uniform disk should be noted.<br />
<strong>The</strong> ISI employs effective baselines <strong>of</strong><br />
about 20 - 56 meters. This corresponds to angular resolutions between ∼20 <strong>and</strong> 60 mas.<br />
<strong>The</strong> “sharp” edge <strong>of</strong> a uniform disk pr<strong>of</strong>ile is too narrow a feature to be resolved with the<br />
ISI. <strong>The</strong> correct interpretation <strong>of</strong> our data (as a certain sized disk) is conditional on the<br />
4 At spatial frequencies near the null <strong>of</strong> the visibility function, half <strong>of</strong> the measured data points lie below<br />
zero (because <strong>of</strong> r<strong>and</strong>om fluctuations in the fringe power). <strong>The</strong>ir square roots would not be able to be fitted<br />
to a uniform disk visibility curve.





![Problem #1 [Structure Formation I: Radiation Era]](https://img.yumpu.com/37147371/1/190x245/problem-1-structure-formation-i-radiation-era.jpg?quality=85)
