Geographic Area <strong>Population</strong> Estimates 1-Jul-05 1-Jul-04 1-Jul-03 1-Jul-02 1-Jul-01 1-Jul-00 1-Jul-99 1-Jul-98 Missouri 5,787,885 5,744,753 5,705,971 5,676,209 5,641,517 5,606,140 5468338 5437562 Montana 935,784 926,721 917,453 910,282 906,098 903,329 882779 879533 Nebraska 1,754,042 1,743,954 1,734,746 1,725,545 1,718,280 1,713,322 1666028 1660772 Nevada 2,408,948 2,329,960 2,238,336 2,167,645 2,095,331 2,018,494 1809253 1743772 New Hampshire 1,303,112 1,294,285 1,282,844 1,272,185 1,257,347 1,240,442 1201134 1185823 New Jersey 8,657,445 8,641,235 8,604,990 8,558,327 8,495,644 8,431,951 8143412 8095542 New Mexico 1,916,331 1,892,182 1,870,113 1,850,562 1,829,032 1,820,861 1739844 1733535 New York 19,262,545 19,258,479 19,207,652 19,132,542 19,076,610 18,996,571 18196601 18159175 North Carolina 8,679,089 8,538,378 8,421,149 8,319,293 8,203,565 8,079,777 7650789 7545828 North Dakota 635,938 636,814 633,159 633,861 636,385 641,236 633666 637808 Ohio 11,459,776 11,452,808 11,435,980 11,414,816 11,392,869 11,364,143 11256654 11237752 Oklahoma 3,535,926 3,516,552 3,499,937 3,485,515 3,464,818 3,454,058 3358044 3339478 Oregon 3,629,959 3,583,027 3,556,956 3,521,520 3,472,224 3,431,096 3316154 3282055 Pennsylvania 12,367,276 12,348,618 12,327,250 12,305,751 12,287,542 12,285,564 11994016 12002329 Rhode Island 1,066,721 1,072,859 1,072,629 1,066,888 1,058,474 1,050,807 990819 987704 South Carolina 4,254,989 4,201,437 4,146,770 4,104,683 4,062,933 4,023,628 3885736 3839578 South Dakota 780,046 774,129 766,882 761,995 758,852 755,713 733133 730789 Tennessee 5,989,309 5,912,063 5,853,371 5,801,841 5,754,637 5,703,415 5483535 5432679 Texas 22,843,999 22,454,811 22,085,973 21,730,350 21,340,494 20,948,843 20044141 19712389 Utah 2,505,013 2,430,841 2,373,260 2,336,872 2,292,177 2,244,431 2129836 2100562 Vermont 619,736 618,794 617,101 615,250 612,225 609,909 593740 590579 Virginia 7,557,588 7,464,033 7,370,557 7,281,659 7,190,468 7,104,992 6872912 6789225 Washington 6,270,838 6,189,869 6,118,988 6,061,872 5,990,518 5,911,652 5756361 5687832 West Virginia 1,805,626 1,804,618 1,803,223 1,800,090 1,798,860 1,807,050 1806928 1811688 Wisconsin 5,540,473 5,510,199 5,475,267 5,445,115 5,408,512 5,374,399 5250446 5222124 Wyoming 506,541 503,258 499,368 497,204 493,032 493,985 479602 480045 Source: 1998 to 2005 States: Annual Estimates of <strong>the</strong> <strong>Population</strong> <strong>for</strong> <strong>the</strong> United States and States, and <strong>for</strong> Puerto Rico: April 1, 2000 to July 1, 2007 (NST-EST2005-01), <strong>Population</strong> Division, U.S. Census Bureau, Release Date: December 22, 2005. (http://www.census.gov/popest/states/NST-ann-est.html) 1998 to 2005 Regions: Annual Estimates of <strong>the</strong> <strong>Population</strong> <strong>for</strong> <strong>the</strong> United States, Regions, and Divisions: April 1, 2000 to July 1, 2007 (NST-EST2005-08), <strong>Population</strong> Division, U.S. Census Bureau, Release Date: December 22, 2005. (http://www.census.gov/popest/states/NST-ann-est.html) A-5
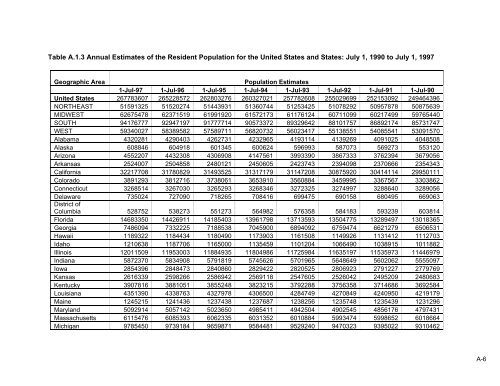
Table A.1.3 Annual Estimates of <strong>the</strong> Resident <strong>Population</strong> <strong>for</strong> <strong>the</strong> United States and States: July 1, 1990 to July 1, 1997 Geographic Area <strong>Population</strong> Estimates 1-Jul-97 1-Jul-96 1-Jul-95 1-Jul-94 1-Jul-93 1-Jul-92 1-Jul-91 1-Jul-90 United States 267783607 265228572 262803276 260327021 257782608 255029699 252153092 249464396 NORTHEAST 51591325 51520274 51443931 51360744 51253425 51078292 50957878 50875639 MIDWEST 62675478 62371519 61991920 61572173 61176124 60711099 60217499 59765440 SOUTH 94176777 92947197 91777714 90573372 89329642 88101757 86892174 85731747 WEST 59340027 58389582 57589711 56820732 56023417 55138551 54085541 53091570 Alabama 4320281 4290403 4262731 4232965 4193114 4139269 4091025 4048508 Alaska 608846 604918 601345 600624 596993 587073 569273 553120 Arizona 4552207 4432308 4306908 4147561 3993390 3867333 3762394 3679056 Arkansas 2524007 2504858 2480121 2450605 2423743 2394098 2370666 2354343 Cali<strong>for</strong>nia 32217708 31780829 31493525 31317179 31147208 30875920 30414114 29950111 Colorado 3891293 3812716 3738061 3653910 3560884 3459995 3367567 3303862 Connecticut 3268514 3267030 3265293 3268346 3272325 3274997 3288640 3289056 Delaware 735024 727090 718265 708416 699475 690158 680495 669063 District of Columbia 528752 538273 551273 564982 576358 584183 593239 603814 Florida 14683350 14426911 14185403 13961798 13713593 13504775 13289497 13018365 Georgia 7486094 7332225 7188538 7045900 6894092 6759474 6621279 6506531 Hawaii 1189322 1184434 1180490 1173903 1161508 1149926 1131412 1112703 Idaho 1210638 1187706 1165000 1135459 1101204 1066490 1038915 1011882 Illinois 12011509 11953003 11884935 11804986 11725984 11635197 11535973 11446979 Indiana 5872370 5834908 5791819 5745626 5701965 5648649 5602062 5555097 Iowa 2854396 2848473 2840860 2829422 2820525 2806923 2791227 2779769 Kansas 2616339 2598266 2586942 2569118 2547605 2526042 2495209 2480683 Kentucky 3907816 3881051 3855248 3823215 3792288 3756358 3714686 3692584 Louisiana 4351390 4338763 4327978 4306500 4284749 4270849 4240950 4219179 Maine 1245215 1241436 1237438 1237687 1238256 1235748 1235439 1231296 Maryland 5092914 5057142 5023650 4985411 4942504 4902545 4856176 4797431 Massachusetts 6115476 6085393 6062335 6031352 6010884 5993474 5998652 6018664 Michigan 9785450 9739184 9659871 9584481 9529240 9470323 9395022 9310462 A-6
- Page 1 and 2: HCUP Methods Series
- Page 3 and 4: Population Denominator Data for Use
- Page 5 and 6: Table A.3.2 Annual Estimates of the
- Page 7 and 8: Table 1. Population Denominator Dat
- Page 9 and 10: • Update cycle for data • Web r
- Page 11 and 12: American Community Survey (ACS) Spo
- Page 13 and 14: Behavioral Risk Factors Surveillanc
- Page 15 and 16: Bureau of Labor Statistics (BLS) Sp
- Page 17 and 18: Centers for Medicare & Medicaid Ser
- Page 19 and 20: Economic Research Service (ERS) Spo
- Page 21 and 22: Health Resources and Services Admin
- Page 23 and 24: Medical Expenditure Panel Survey (M
- Page 25 and 26: National Comorbidity Survey Replica
- Page 27 and 28: National Health Interview Survey (N
- Page 29 and 30: National Vital Statistics System (N
- Page 31 and 32: Small Area Health Insurance Estimat
- Page 33 and 34: Statistical Abstract of the United
- Page 35 and 36: Survey of Income and Program Partic
- Page 37 and 38: Washington, Wyoming, Alaska, Montan
- Page 39 and 40: Table A.1.1 Annual Estimates of the
- Page 41: Table A.1.2 Annual Estimates of the
- Page 45 and 46: Table A.2.1 Annual Estimates of the
- Page 47 and 48: Population Estimates Sex and Age (Y
- Page 49 and 50: Population Estimates Sex and Age (Y
- Page 51 and 52: Table A.2.3 Annual Estimates of the
- Page 53 and 54: Table A.3.1 Annual Estimates of the
- Page 55 and 56: Sex, Hispanic or Latino origin, Pop
- Page 57 and 58: Sex, Hispanic or Latino origin, Pop
- Page 59 and 60: Sex, Hispanic or Latino origin, and
- Page 61 and 62: Sex, Hispanic or Latino origin, and
- Page 63 and 64: Table A.3.3 Annual Estimates of the
- Page 65 and 66: Table A.4.1 Annual Estimates of the
- Page 67 and 68: APPENDIX B. USING PAYER POPULATION
- Page 69 and 70: Time Dimension Differences Problem: