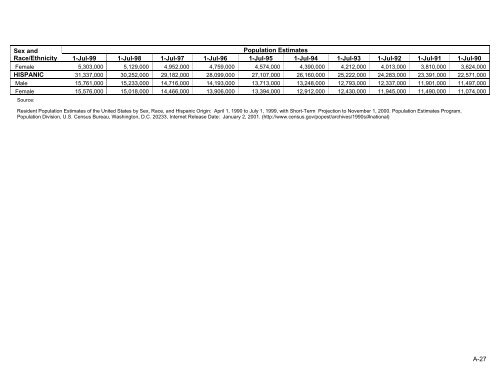
Sex and <strong>Population</strong> Estimates Race/Ethnicity 1-Jul-99 1-Jul-98 1-Jul-97 1-Jul-96 1-Jul-95 1-Jul-94 1-Jul-93 1-Jul-92 1-Jul-91 1-Jul-90 Female 5,303,000 5,129,000 4,952,000 4,759,000 4,574,000 4,390,000 4,212,000 4,013,000 3,810,000 3,624,000 HISPANIC 31,337,000 30,252,000 29,182,000 28,099,000 27,107,000 26,160,000 25,222,000 24,283,000 23,391,000 22,571,000 Male 15,761,000 15,233,000 14,716,000 14,193,000 13,713,000 13,248,000 12,793,000 12,337,000 11,901,000 11,497,000 Female 15,576,000 15,018,000 14,466,000 13,906,000 13,394,000 12,912,000 12,430,000 11,945,000 11,490,000 11,074,000 Source: Resident <strong>Population</strong> Estimates of <strong>the</strong> United States by Sex, Race, and Hispanic Origin: April 1, 1990 to July 1, 1999, <strong>with</strong> Short-Term Projection to November 1, 2000. <strong>Population</strong> Estimates Program, <strong>Population</strong> Division, U.S. Census Bureau, Washington, D.C. 20233, Internet Release Date: January 2, 2001. (http://www.census.gov/popest/archives/1990s/#national) A-27
Table A.4.1 Annual Estimates of <strong>the</strong> U.S. <strong>Population</strong> by Median Household Income Quartile, 2001 to 2006 Median <strong>Population</strong> Estimates Household Income Quartile 2001 2002 2003 2004 2005 2006 Quartile 1 70,808,587 74,924,336 69,664,519 76,323,231 72,184,620 74,069,384 Quartile 2 72,417,821 67,591,640 73,559,081 73,175,783 73,179,269 72,324,060 Quartile 3 70,933,564 74,520,370 76,465,150 68,746,327 75,674,376 75,968,161 Quartile 4 69,738,298 69,706,370 70,937,808 74,642,649 74,058,028 75,615,954 Total U.S. 283,898,269 286,742,716 290,626,558 292,887,990 295,096,293 297,977,559 Source: Claritas <strong>Population</strong> Estimates, 2001 to 2006 Because <strong>the</strong> cut-points <strong>for</strong> <strong>the</strong> median household income quartiles are updated annually, <strong>the</strong> value ranges <strong>for</strong> <strong>the</strong> quartiles vary by year. The dollar ranges represented by each category are: Median Quartile Ranges Household Income Quartile 2001 2002 2003 2004 2005 2006 Quartile 1 Quartile 2 1- 33,999 34,000- 43,999 44,000- 58,999 1- 35,999 36,000- 45,999 46,000- 61,999 1- 35,999 36,000- 44,999 45,000- 59,999 1- 35,999 36,000- 44,999 45,000- 58,999 1- 36,999 37,000- 45,999 46,000- 60,999 1- 37,999 38,000- 46,999 47,000- 61,999 Quartile 3 Quartile 4 59,000+ 62,000+ 60,000+ 59,000+ 61,000+ 62,000+ In <strong>the</strong> <strong>HCUP</strong> databases, <strong>the</strong> data element ZIPINC_QRTL contains <strong>the</strong> median household income quartile, values 1 to 4, <strong>for</strong> <strong>the</strong> ZIP Code of <strong>the</strong> patient’s residence. The above population data table uses <strong>the</strong> same definitions of median household income. A-28
- Page 1 and 2:
HCUP Methods Series
- Page 3 and 4:
Population Denominator Data for Use
- Page 5 and 6:
Table A.3.2 Annual Estimates of the
- Page 7 and 8:
Table 1. Population Denominator Dat
- Page 9 and 10:
• Update cycle for data • Web r
- Page 11 and 12:
American Community Survey (ACS) Spo
- Page 13 and 14: Behavioral Risk Factors Surveillanc
- Page 15 and 16: Bureau of Labor Statistics (BLS) Sp
- Page 17 and 18: Centers for Medicare & Medicaid Ser
- Page 19 and 20: Economic Research Service (ERS) Spo
- Page 21 and 22: Health Resources and Services Admin
- Page 23 and 24: Medical Expenditure Panel Survey (M
- Page 25 and 26: National Comorbidity Survey Replica
- Page 27 and 28: National Health Interview Survey (N
- Page 29 and 30: National Vital Statistics System (N
- Page 31 and 32: Small Area Health Insurance Estimat
- Page 33 and 34: Statistical Abstract of the United
- Page 35 and 36: Survey of Income and Program Partic
- Page 37 and 38: Washington, Wyoming, Alaska, Montan
- Page 39 and 40: Table A.1.1 Annual Estimates of the
- Page 41 and 42: Table A.1.2 Annual Estimates of the
- Page 43 and 44: Table A.1.3 Annual Estimates of the
- Page 45 and 46: Table A.2.1 Annual Estimates of the
- Page 47 and 48: Population Estimates Sex and Age (Y
- Page 49 and 50: Population Estimates Sex and Age (Y
- Page 51 and 52: Table A.2.3 Annual Estimates of the
- Page 53 and 54: Table A.3.1 Annual Estimates of the
- Page 55 and 56: Sex, Hispanic or Latino origin, Pop
- Page 57 and 58: Sex, Hispanic or Latino origin, Pop
- Page 59 and 60: Sex, Hispanic or Latino origin, and
- Page 61 and 62: Sex, Hispanic or Latino origin, and
- Page 63: Table A.3.3 Annual Estimates of the
- Page 67 and 68: APPENDIX B. USING PAYER POPULATION
- Page 69 and 70: Time Dimension Differences Problem: