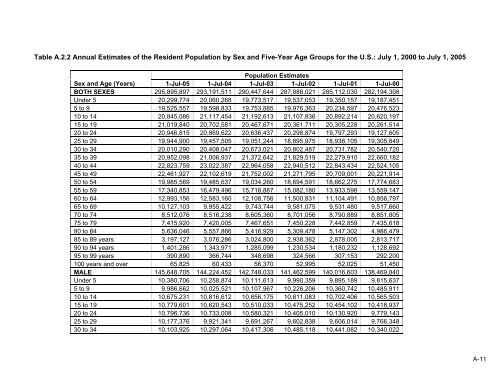
Table A.2.2 Annual Estimates of <strong>the</strong> Resident <strong>Population</strong> by Sex and Five-Year Age Groups <strong>for</strong> <strong>the</strong> U.S.: July 1, 2000 to July 1, 2005 <strong>Population</strong> Estimates Sex and Age (Years) 1-Jul-05 1-Jul-04 1-Jul-03 1-Jul-02 1-Jul-01 1-Jul-00 BOTH SEXES 295,895,897 293,191,511 290,447,644 287,888,021 285,112,030 282,194,308 Under 5 20,299,774 20,060,268 19,773,517 19,537,053 19,350,157 19,187,451 5 to 9 19,525,557 19,598,833 19,753,885 19,976,363 20,234,597 20,476,523 10 to 14 20,845,086 21,117,454 21,192,613 21,107,836 20,892,214 20,620,197 15 to 19 21,019,840 20,702,581 20,467,671 20,361,711 20,305,228 20,261,514 20 to 24 20,946,815 20,869,622 20,636,437 20,298,874 19,797,293 19,127,605 25 to 29 19,944,900 19,457,505 19,051,244 18,895,975 18,938,105 19,305,849 30 to 34 20,010,290 20,408,047 20,673,021 20,802,487 20,731,782 20,540,720 35 to 39 20,952,098 21,006,937 21,372,642 21,829,519 22,279,910 22,660,182 40 to 44 22,823,759 23,022,387 22,964,058 22,940,512 22,843,434 22,524,105 45 to 49 22,461,927 22,102,619 21,752,002 21,271,795 20,709,001 20,221,914 50 to 54 19,985,569 19,485,637 19,034,260 18,694,591 18,662,275 17,774,683 55 to 59 17,340,853 16,479,496 15,718,887 15,082,180 13,933,598 13,559,147 60 to 64 12,993,156 12,583,160 12,108,756 11,500,831 11,104,491 10,856,797 65 to 69 10,127,103 9,955,422 9,743,744 9,581,075 9,531,480 9,517,660 70 to 74 8,512,076 8,516,238 8,605,360 8,701,056 8,790,889 8,851,805 75 to 79 7,415,920 7,420,005 7,467,651 7,450,228 7,442,859 7,435,618 80 to 84 5,636,046 5,557,866 5,416,929 5,309,478 5,147,302 4,986,479 85 to 89 years 3,197,127 3,076,286 3,024,800 2,938,362 2,878,005 2,813,717 90 to 94 years 1,401,286 1,343,971 1,285,099 1,230,534 1,180,232 1,128,692 95 to 99 years 390,890 366,744 348,698 324,566 307,153 292,200 100 years and over 65,825 60,433 56,370 52,995 52,025 51,450 MALE 145,648,705 144,224,452 142,748,033 141,462,599 140,016,603 138,469,840 Under 5 10,380,706 10,258,874 10,111,613 9,990,359 9,895,189 9,815,637 5 to 9 9,986,662 10,025,521 10,107,967 10,226,206 10,360,742 10,485,911 10 to 14 10,675,231 10,816,612 10,856,175 10,811,083 10,702,406 10,565,503 15 to 19 10,779,601 10,620,543 10,510,033 10,475,252 10,454,102 10,418,937 20 to 24 10,796,736 10,733,008 10,580,321 10,405,010 10,130,920 9,779,143 25 to 29 10,177,376 9,921,341 9,691,267 9,602,838 9,606,014 9,766,348 30 to 34 10,103,925 10,297,064 10,417,306 10,485,118 10,441,082 10,340,022 A-11
<strong>Population</strong> Estimates Sex and Age (Years) 1-Jul-05 1-Jul-04 1-Jul-03 1-Jul-02 1-Jul-01 1-Jul-00 35 to 39 10,524,937 10,537,668 10,697,214 10,913,175 11,130,716 11,300,564 <strong>Population</strong> Estimates Sex and Age (Years) 1-Jul-05 1-Jul-04 1-Jul-03 1-Jul-02 1-Jul-01 1-Jul-00 40 to 44 11,347,896 11,438,759 11,398,904 11,390,013 11,334,255 11,170,510 45 to 49 11,089,786 10,903,976 10,722,907 10,477,726 10,198,696 9,954,723 50 to 54 9,780,359 9,528,298 9,306,644 9,144,390 9,132,659 8,700,633 55 to 59 8,416,765 7,995,283 7,623,300 7,309,373 6,740,407 6,553,653 60 to 64 6,196,747 5,994,891 5,767,203 5,473,253 5,282,967 5,163,097 65 to 69 4,719,554 4,632,822 4,525,162 4,440,023 4,408,824 4,394,588 70 to 74 3,809,772 3,799,910 3,831,539 3,864,877 3,893,433 3,905,250 75 to 79 3,119,137 3,102,801 3,104,655 3,084,032 3,067,106 3,054,912 80 to 84 2,158,075 2,117,860 2,055,972 2,004,117 1,930,298 1,854,225 85 to 89 years 1,084,775 1,031,973 1,003,048 958,580 924,865 888,489 90 to 94 years 398,153 373,879 349,884 327,986 307,763 287,962 95 to 99 years 89,792 81,854 76,278 68,945 63,970 59,560 100 years and over 12,720 11,515 10,641 10,243 10,189 10,173 FEMALE 150,247,192 148,967,059 147,699,611 146,425,422 145,095,427 143,724,468 Under 5 9,919,068 9,801,394 9,661,904 9,546,694 9,454,968 9,371,814 5 to 9 9,538,895 9,573,312 9,645,918 9,750,157 9,873,855 9,990,612 10 to 14 10,169,855 10,300,842 10,336,438 10,296,753 10,189,808 10,054,694 15 to 19 10,240,239 10,082,038 9,957,638 9,886,459 9,851,126 9,842,577 20 to 24 10,150,079 10,136,614 10,056,116 9,893,864 9,666,373 9,348,462 25 to 29 9,767,524 9,536,164 9,359,977 9,293,137 9,332,091 9,539,501 30 to 34 9,906,365 10,110,983 10,255,715 10,317,369 10,290,700 10,200,698 35 to 39 10,427,161 10,469,269 10,675,428 10,916,344 11,149,194 11,359,618 40 to 44 11,475,863 11,583,628 11,565,154 11,550,499 11,509,179 11,353,595 45 to 49 11,372,141 11,198,643 11,029,095 10,794,069 10,510,305 10,267,191 50 to 54 10,205,210 9,957,339 9,727,616 9,550,201 9,529,616 9,074,050 55 to 59 8,924,088 8,484,213 8,095,587 7,772,807 7,193,191 7,005,494 60 to 64 6,796,409 6,588,269 6,341,553 6,027,578 5,821,524 5,693,700 65 to 69 5,407,549 5,322,600 5,218,582 5,141,052 5,122,656 5,123,072 70 to 74 4,702,304 4,716,328 4,773,821 4,836,179 4,897,456 4,946,555 A-12
- Page 1 and 2: HCUP Methods Series
- Page 3 and 4: Population Denominator Data for Use
- Page 5 and 6: Table A.3.2 Annual Estimates of the
- Page 7 and 8: Table 1. Population Denominator Dat
- Page 9 and 10: • Update cycle for data • Web r
- Page 11 and 12: American Community Survey (ACS) Spo
- Page 13 and 14: Behavioral Risk Factors Surveillanc
- Page 15 and 16: Bureau of Labor Statistics (BLS) Sp
- Page 17 and 18: Centers for Medicare & Medicaid Ser
- Page 19 and 20: Economic Research Service (ERS) Spo
- Page 21 and 22: Health Resources and Services Admin
- Page 23 and 24: Medical Expenditure Panel Survey (M
- Page 25 and 26: National Comorbidity Survey Replica
- Page 27 and 28: National Health Interview Survey (N
- Page 29 and 30: National Vital Statistics System (N
- Page 31 and 32: Small Area Health Insurance Estimat
- Page 33 and 34: Statistical Abstract of the United
- Page 35 and 36: Survey of Income and Program Partic
- Page 37 and 38: Washington, Wyoming, Alaska, Montan
- Page 39 and 40: Table A.1.1 Annual Estimates of the
- Page 41 and 42: Table A.1.2 Annual Estimates of the
- Page 43 and 44: Table A.1.3 Annual Estimates of the
- Page 45 and 46: Table A.2.1 Annual Estimates of the
- Page 47: Population Estimates Sex and Age (Y
- Page 51 and 52: Table A.2.3 Annual Estimates of the
- Page 53 and 54: Table A.3.1 Annual Estimates of the
- Page 55 and 56: Sex, Hispanic or Latino origin, Pop
- Page 57 and 58: Sex, Hispanic or Latino origin, Pop
- Page 59 and 60: Sex, Hispanic or Latino origin, and
- Page 61 and 62: Sex, Hispanic or Latino origin, and
- Page 63 and 64: Table A.3.3 Annual Estimates of the
- Page 65 and 66: Table A.4.1 Annual Estimates of the
- Page 67 and 68: APPENDIX B. USING PAYER POPULATION
- Page 69 and 70: Time Dimension Differences Problem: